Repository navigation
Show the traffic rate over the last five seconds - #327
Conversation


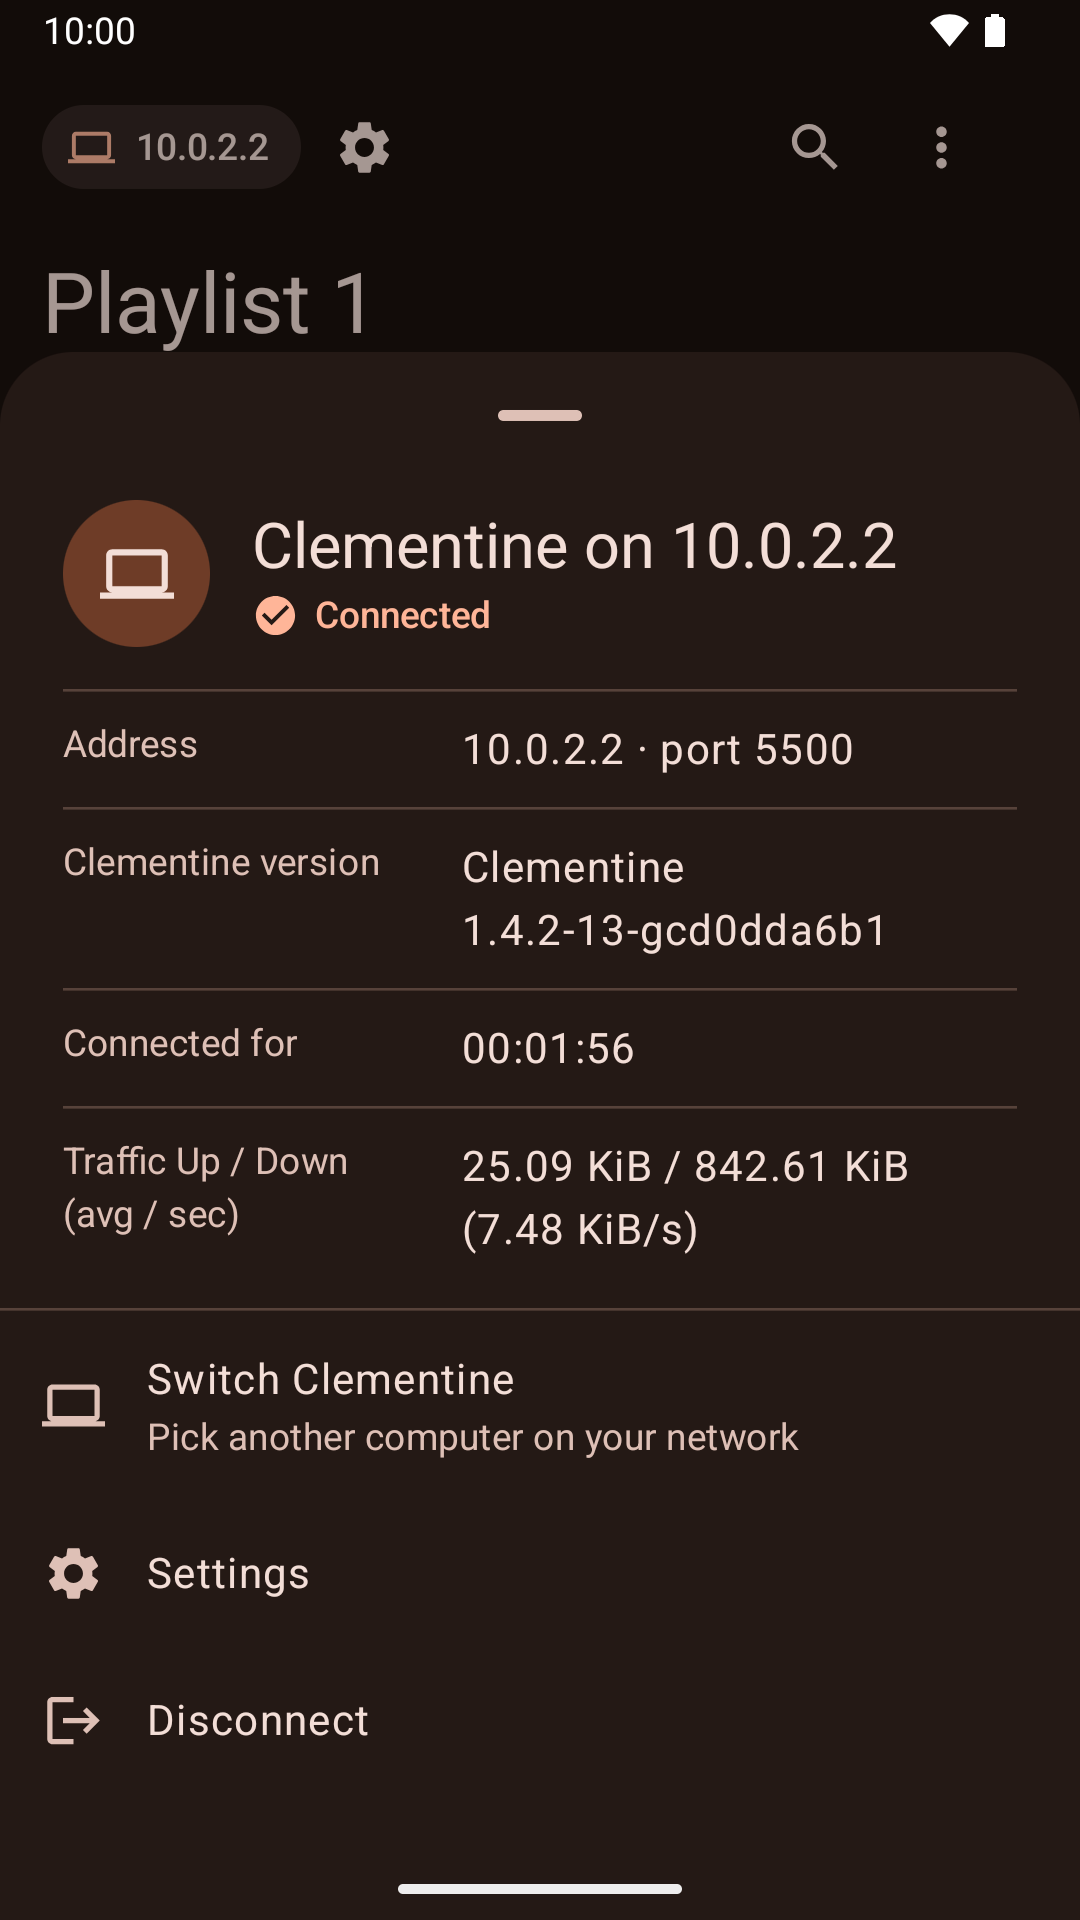
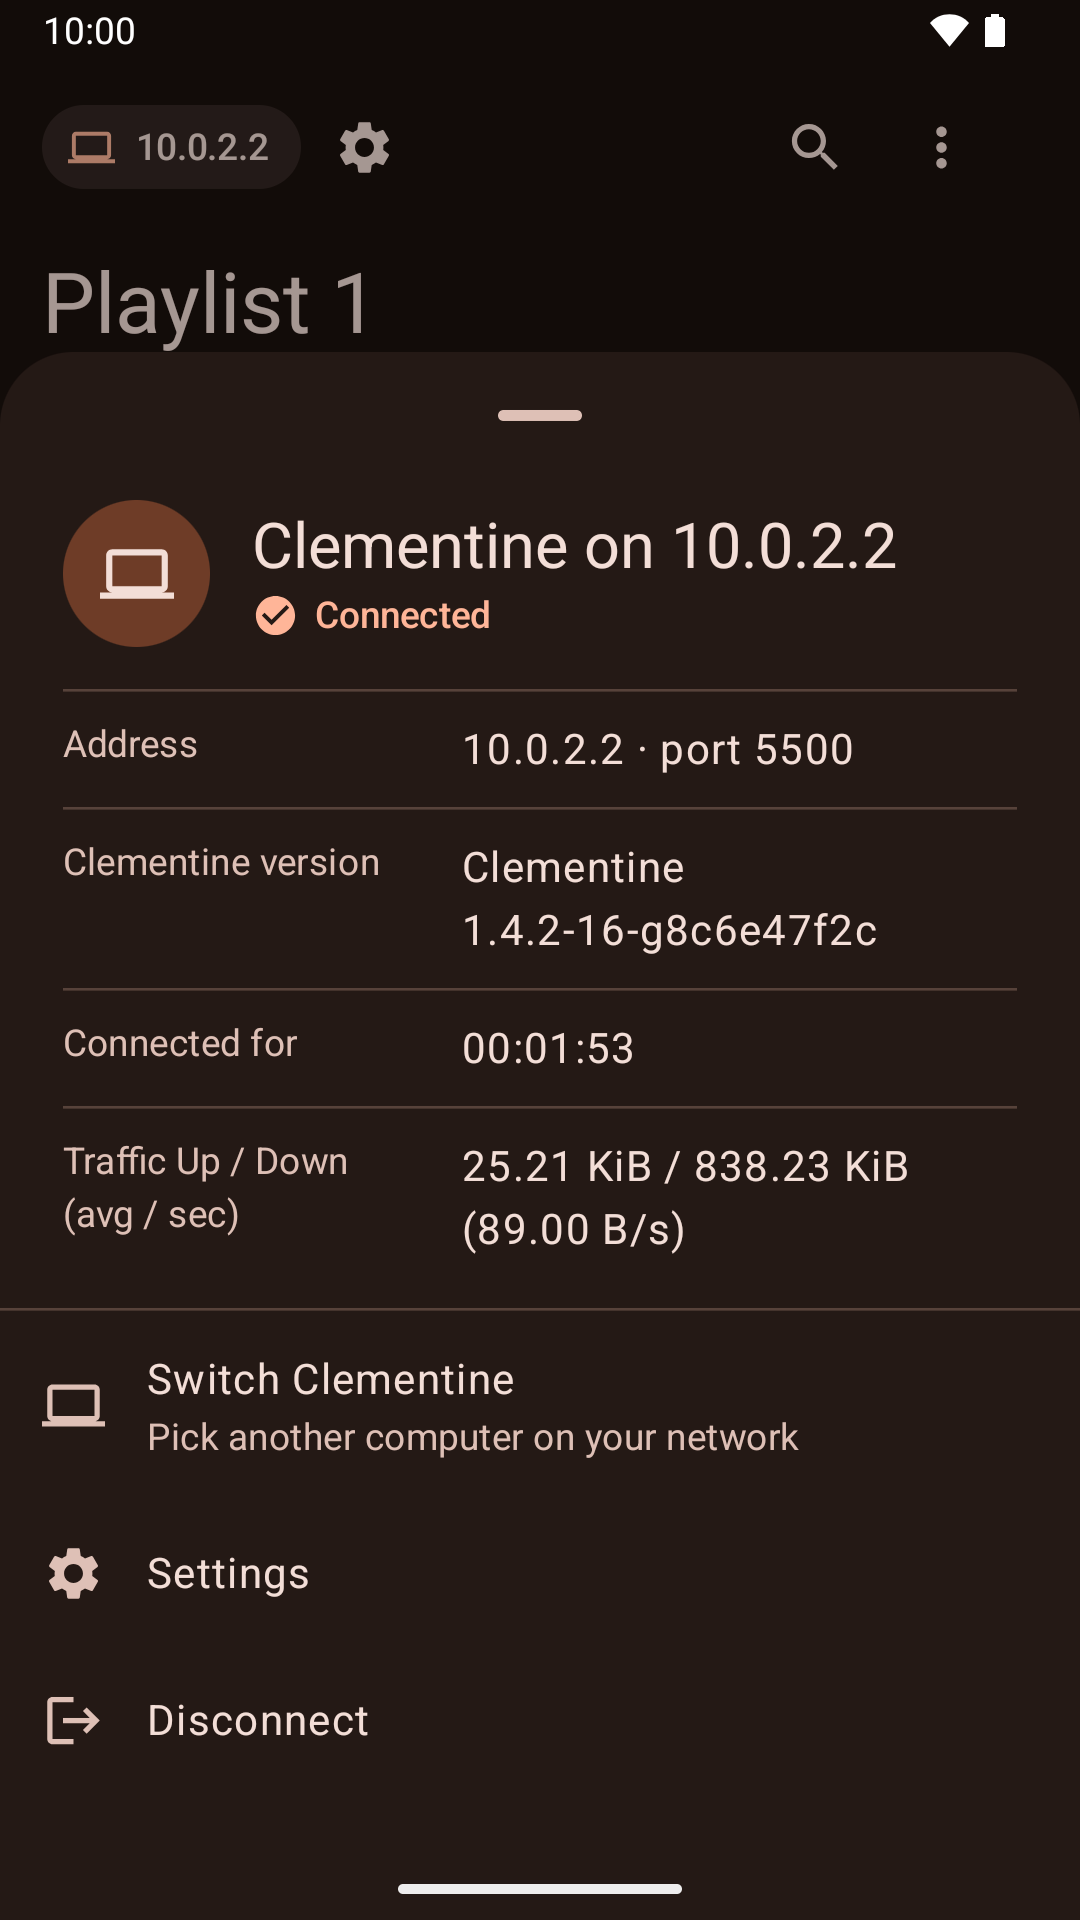
The connection sheet's rate was the average since connecting, so after
streaming stopped it took ages to fall, and read as if data were still
moving. It's now the rate over the last five seconds, from the readings
the sheet already takes twice a second, and it's left out until there are
two readings to compare.

Release-note: The connection details show how fast data is moving now, rather than the average since connecting.
Co-Authored-By: Claude Opus 5.5 <noreply@anthropic.com>
Claude-Session: https://claude.ai/code/session_01CTf1Z6GAbDbQeNJ5BkewC1

|
No fix in this repo is needed. I'll re-run the failed job once when the rest of this workflow run finishes; it's still running, so GitHub won't re-run it yet. Generated by Claude Code |

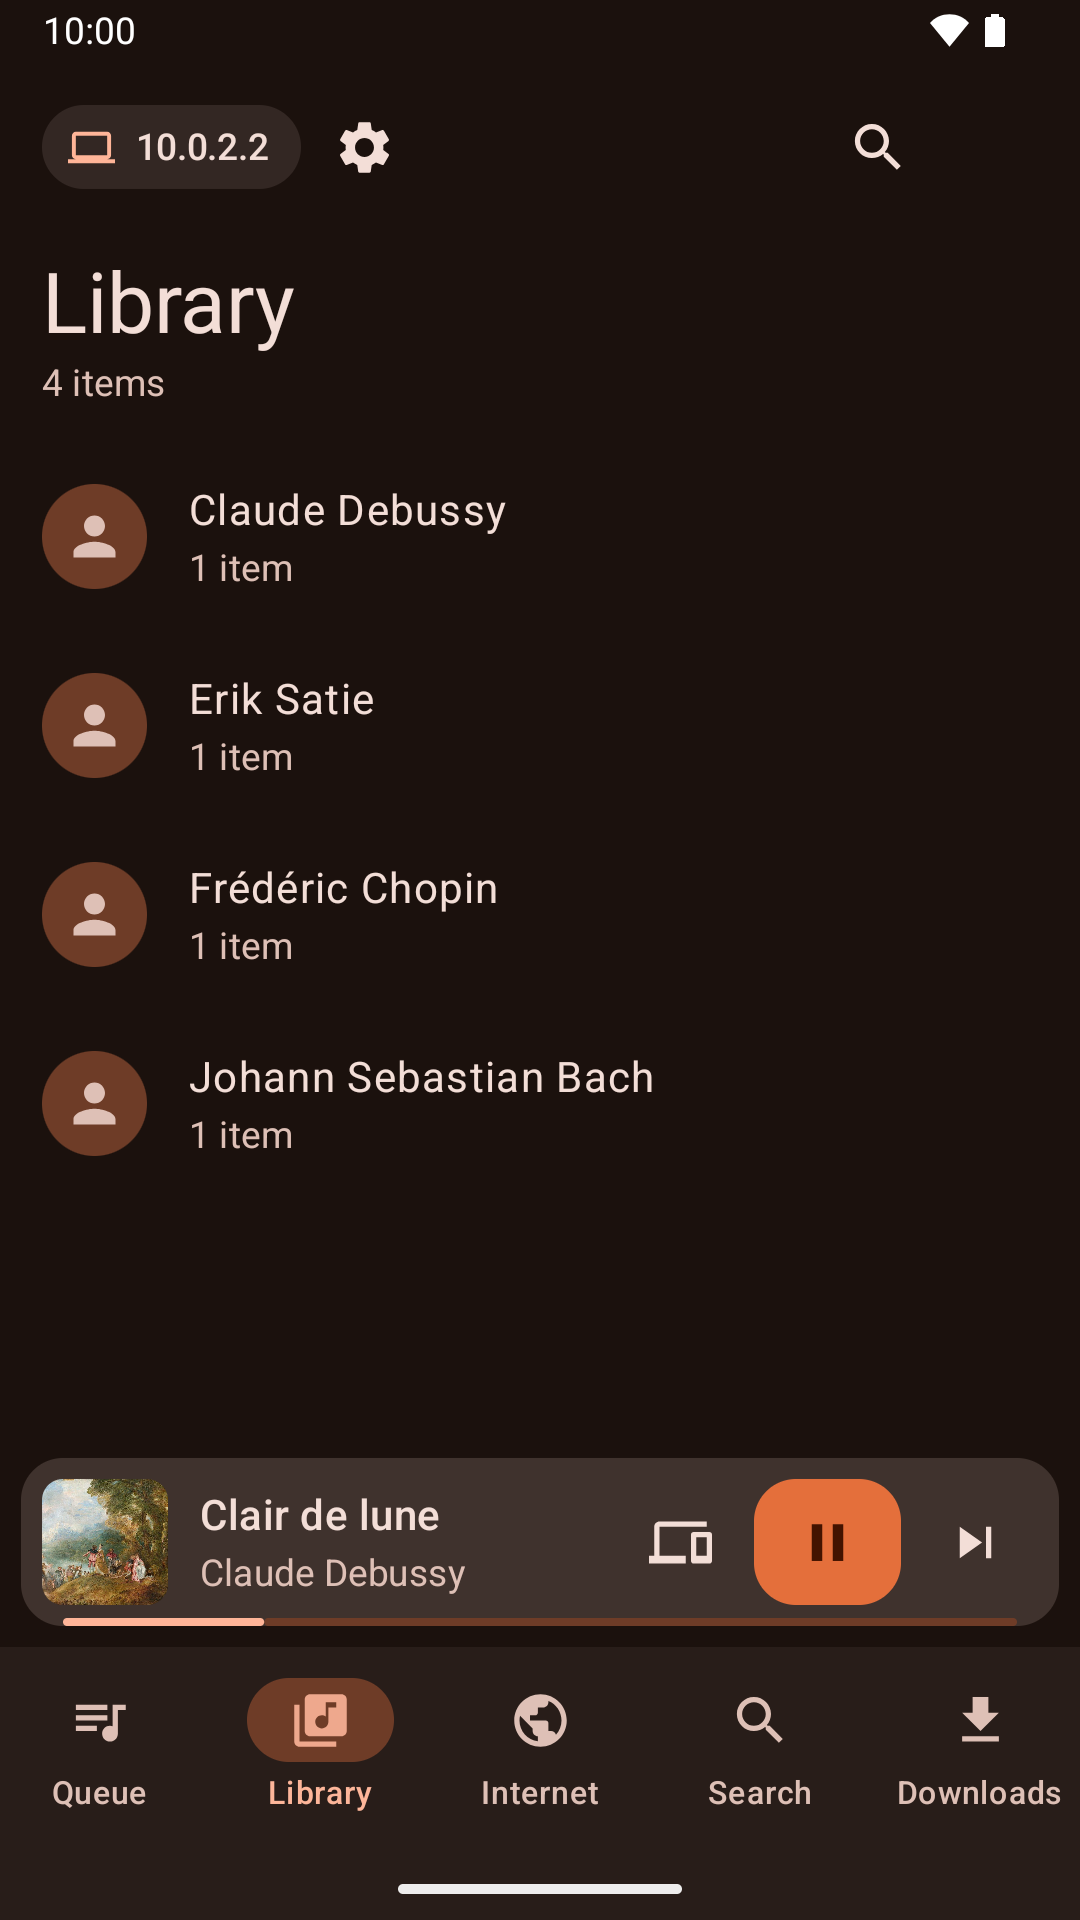
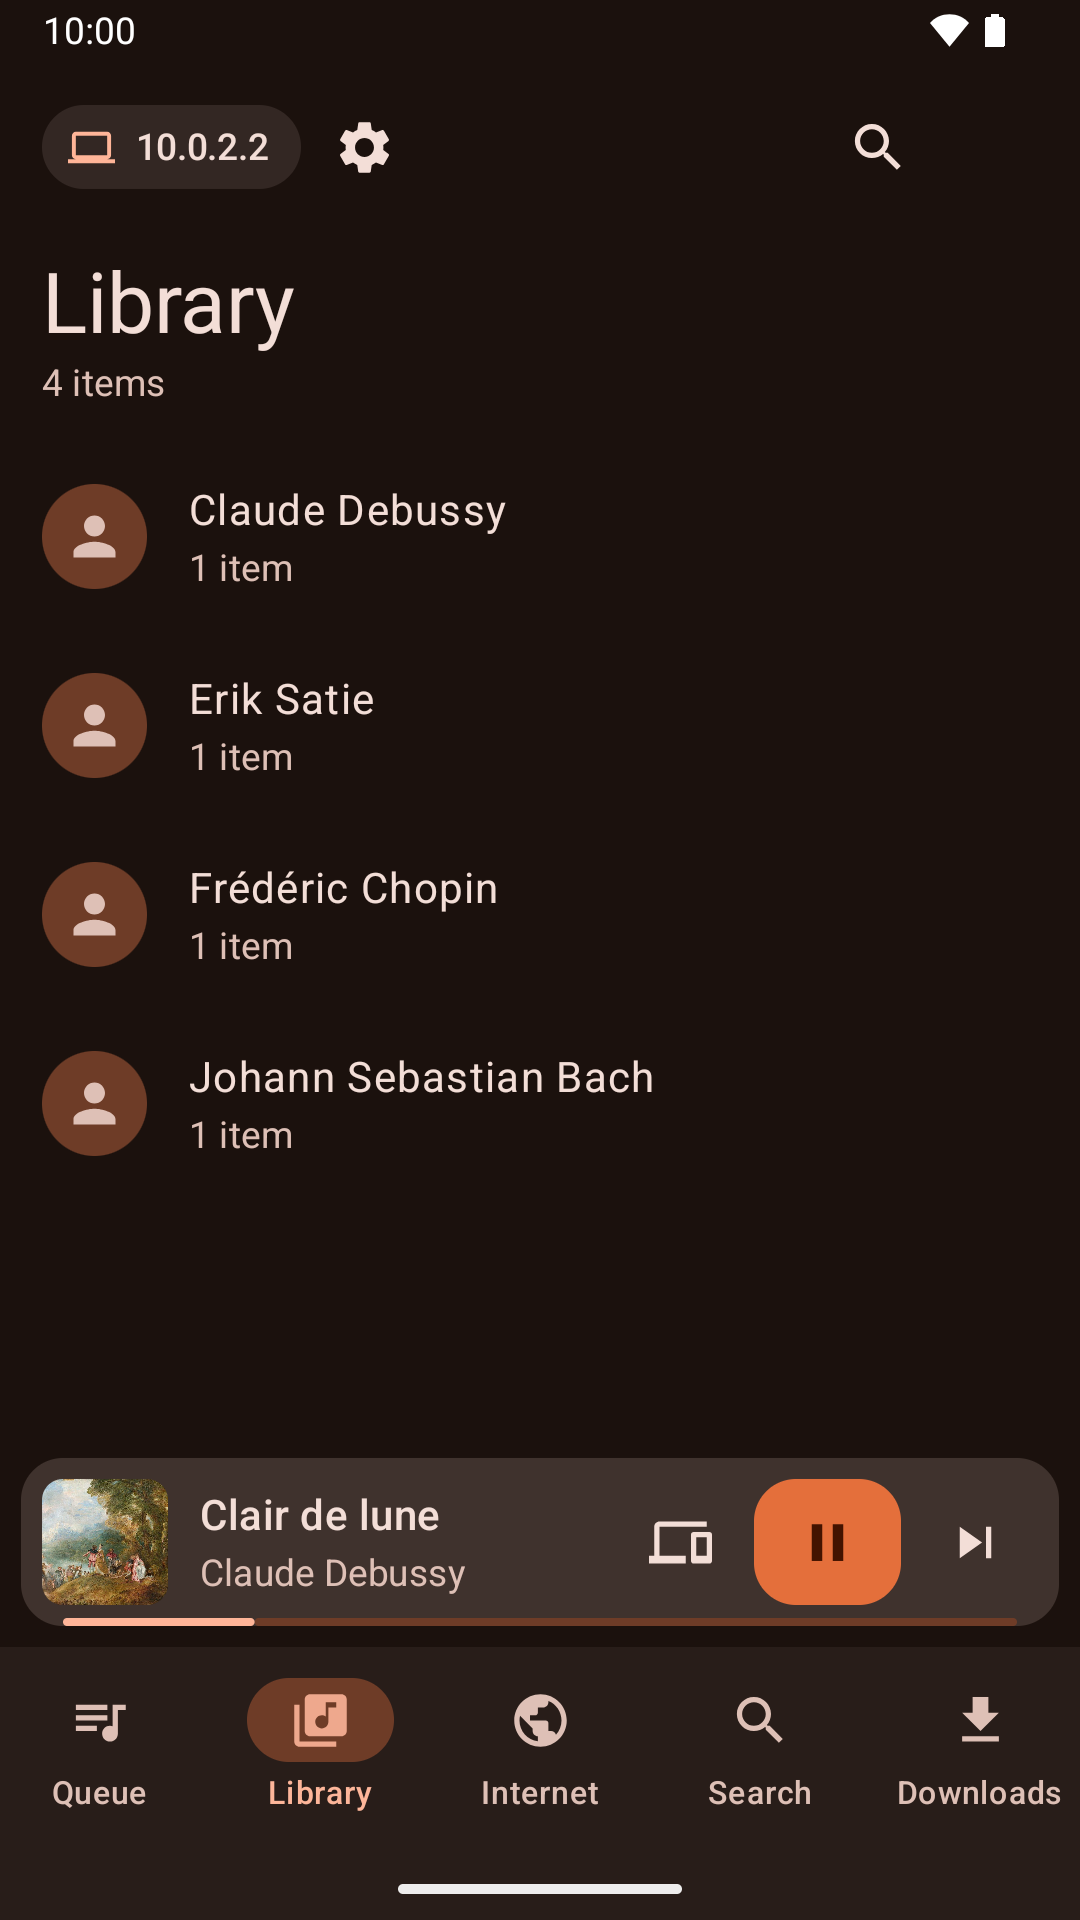
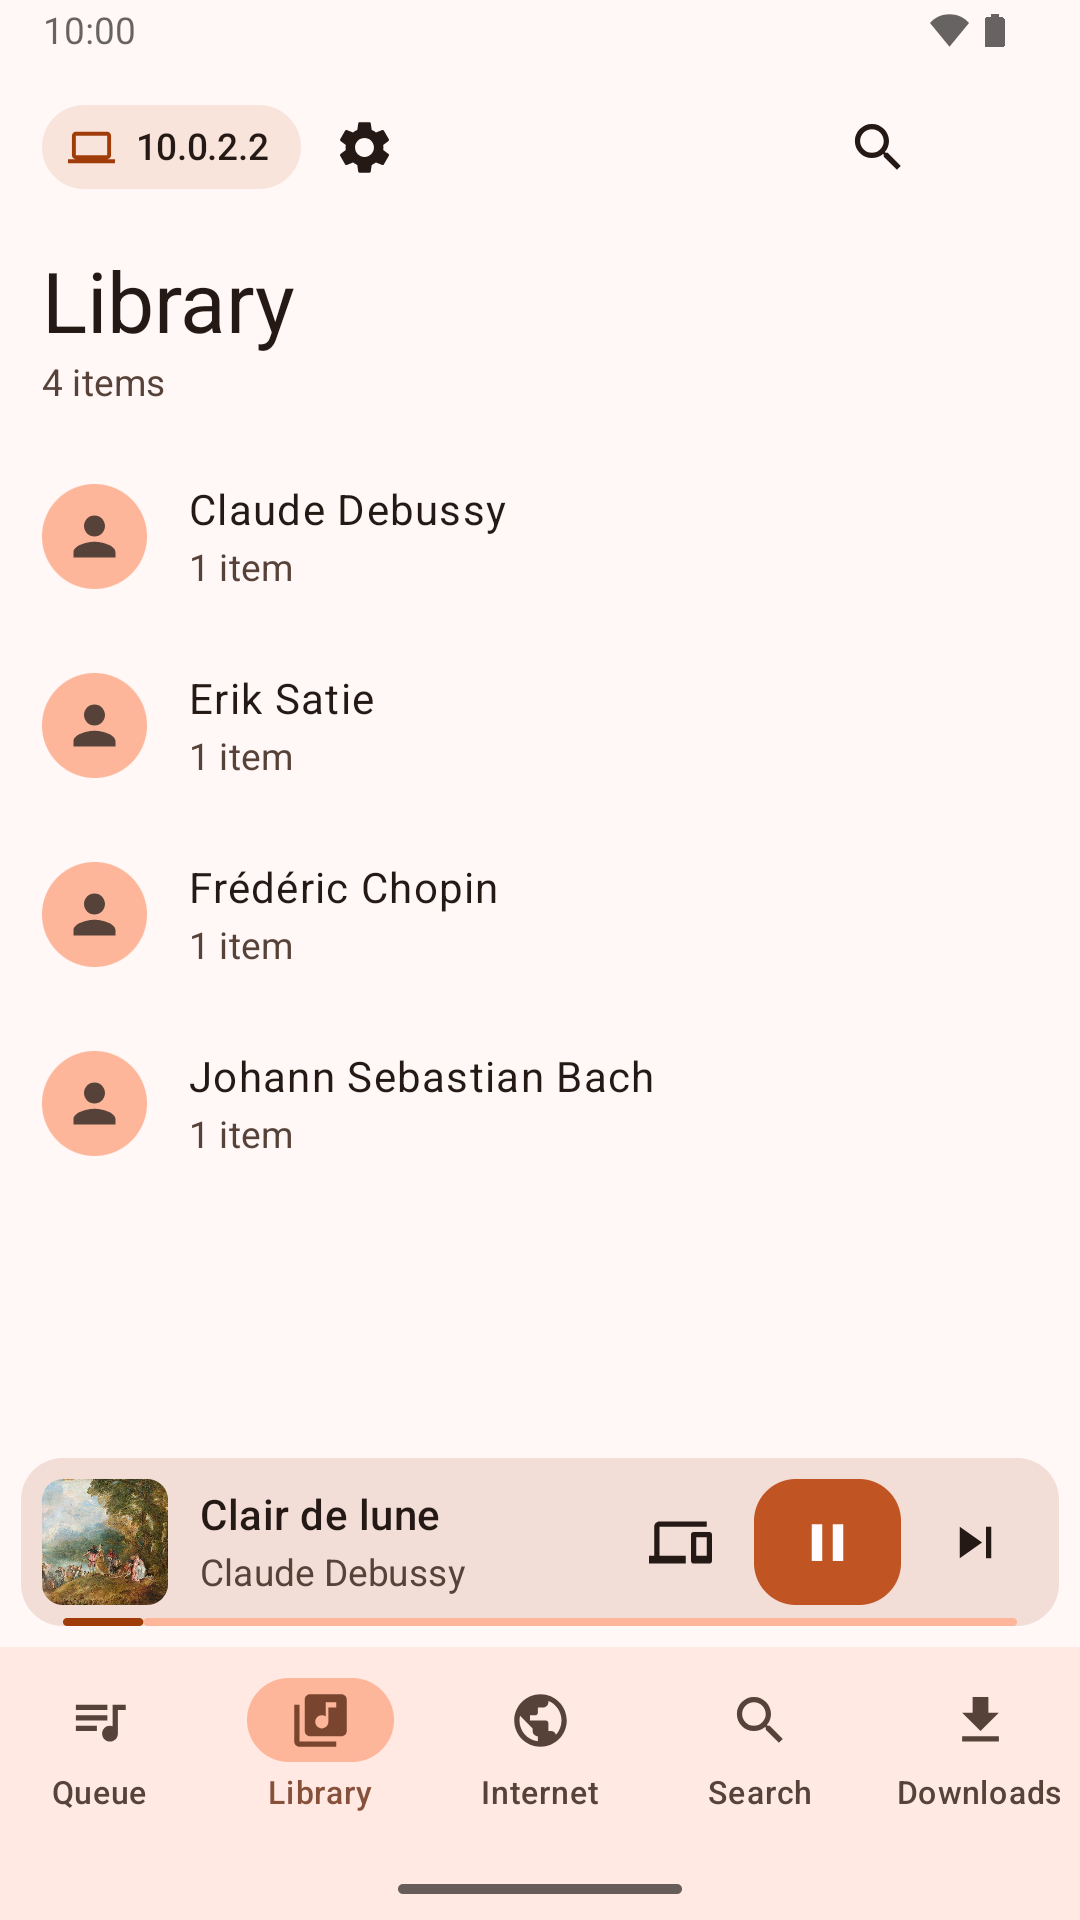
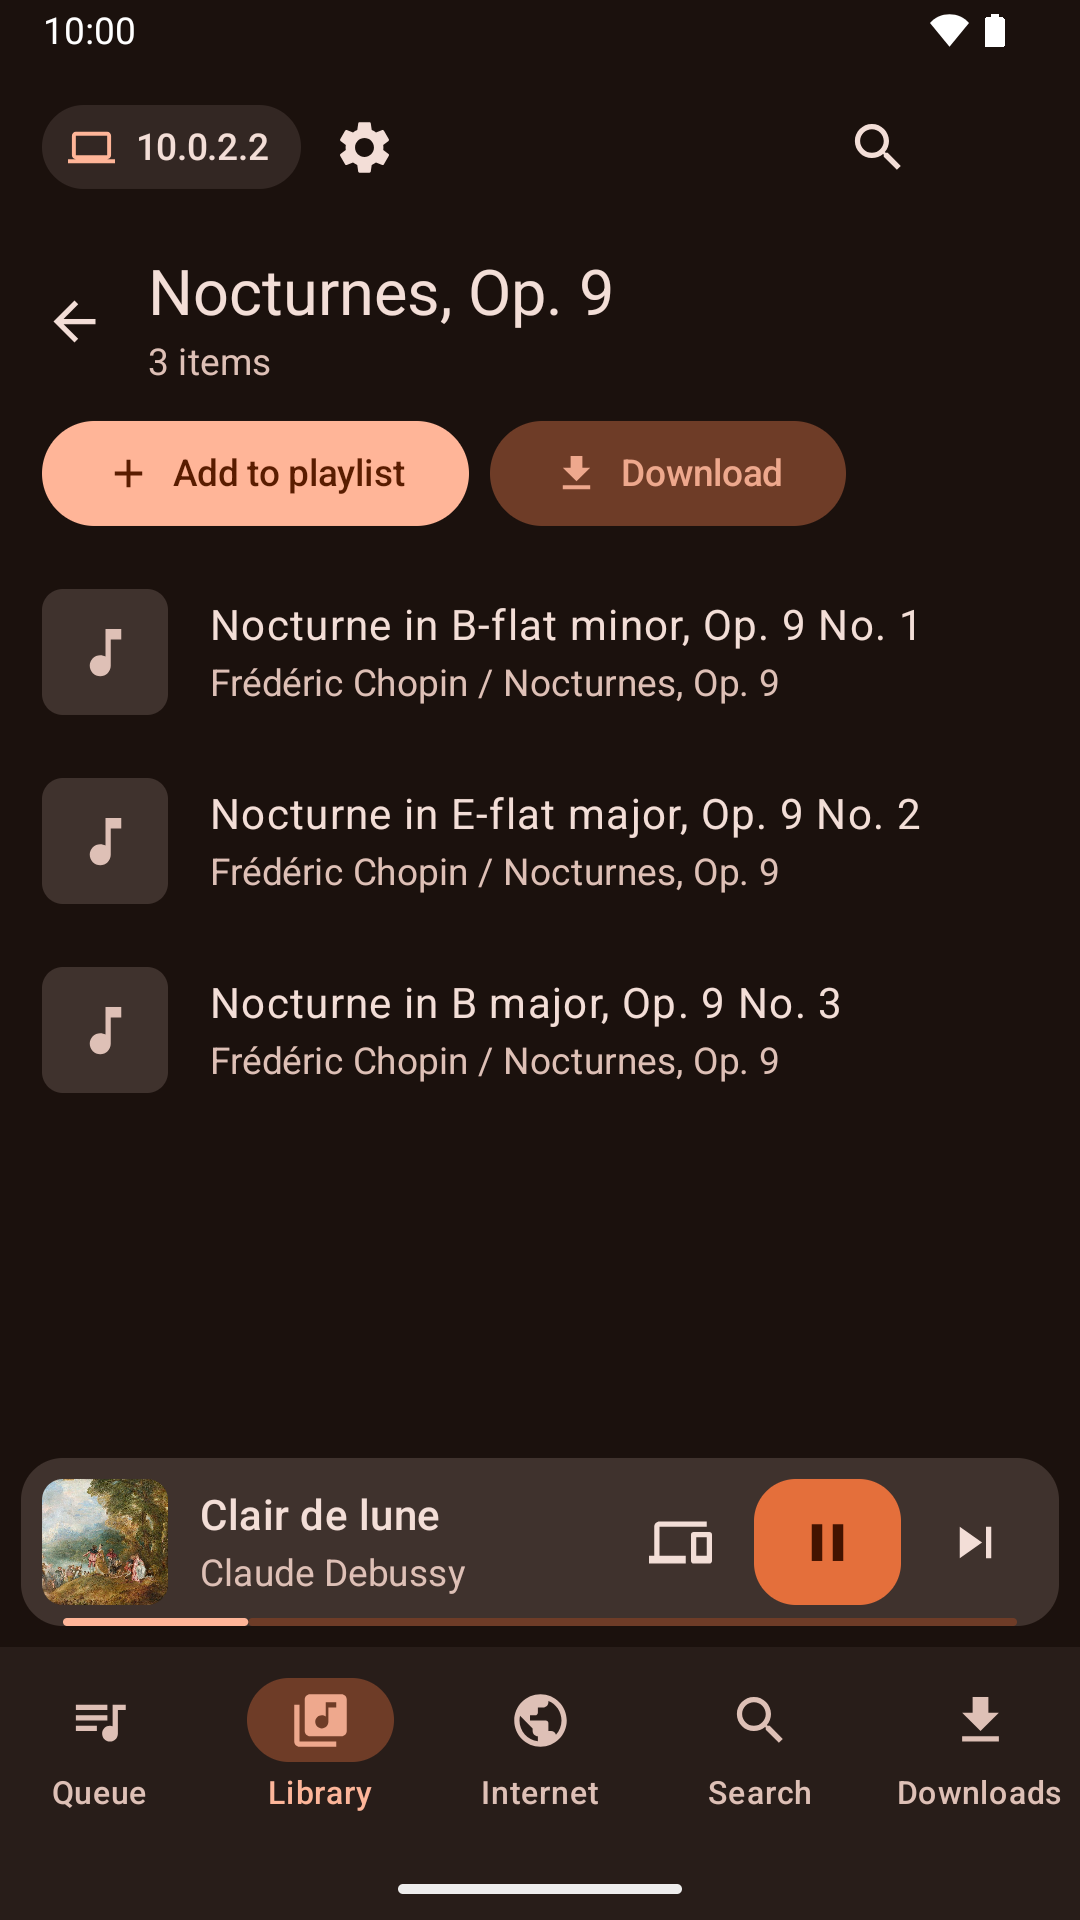
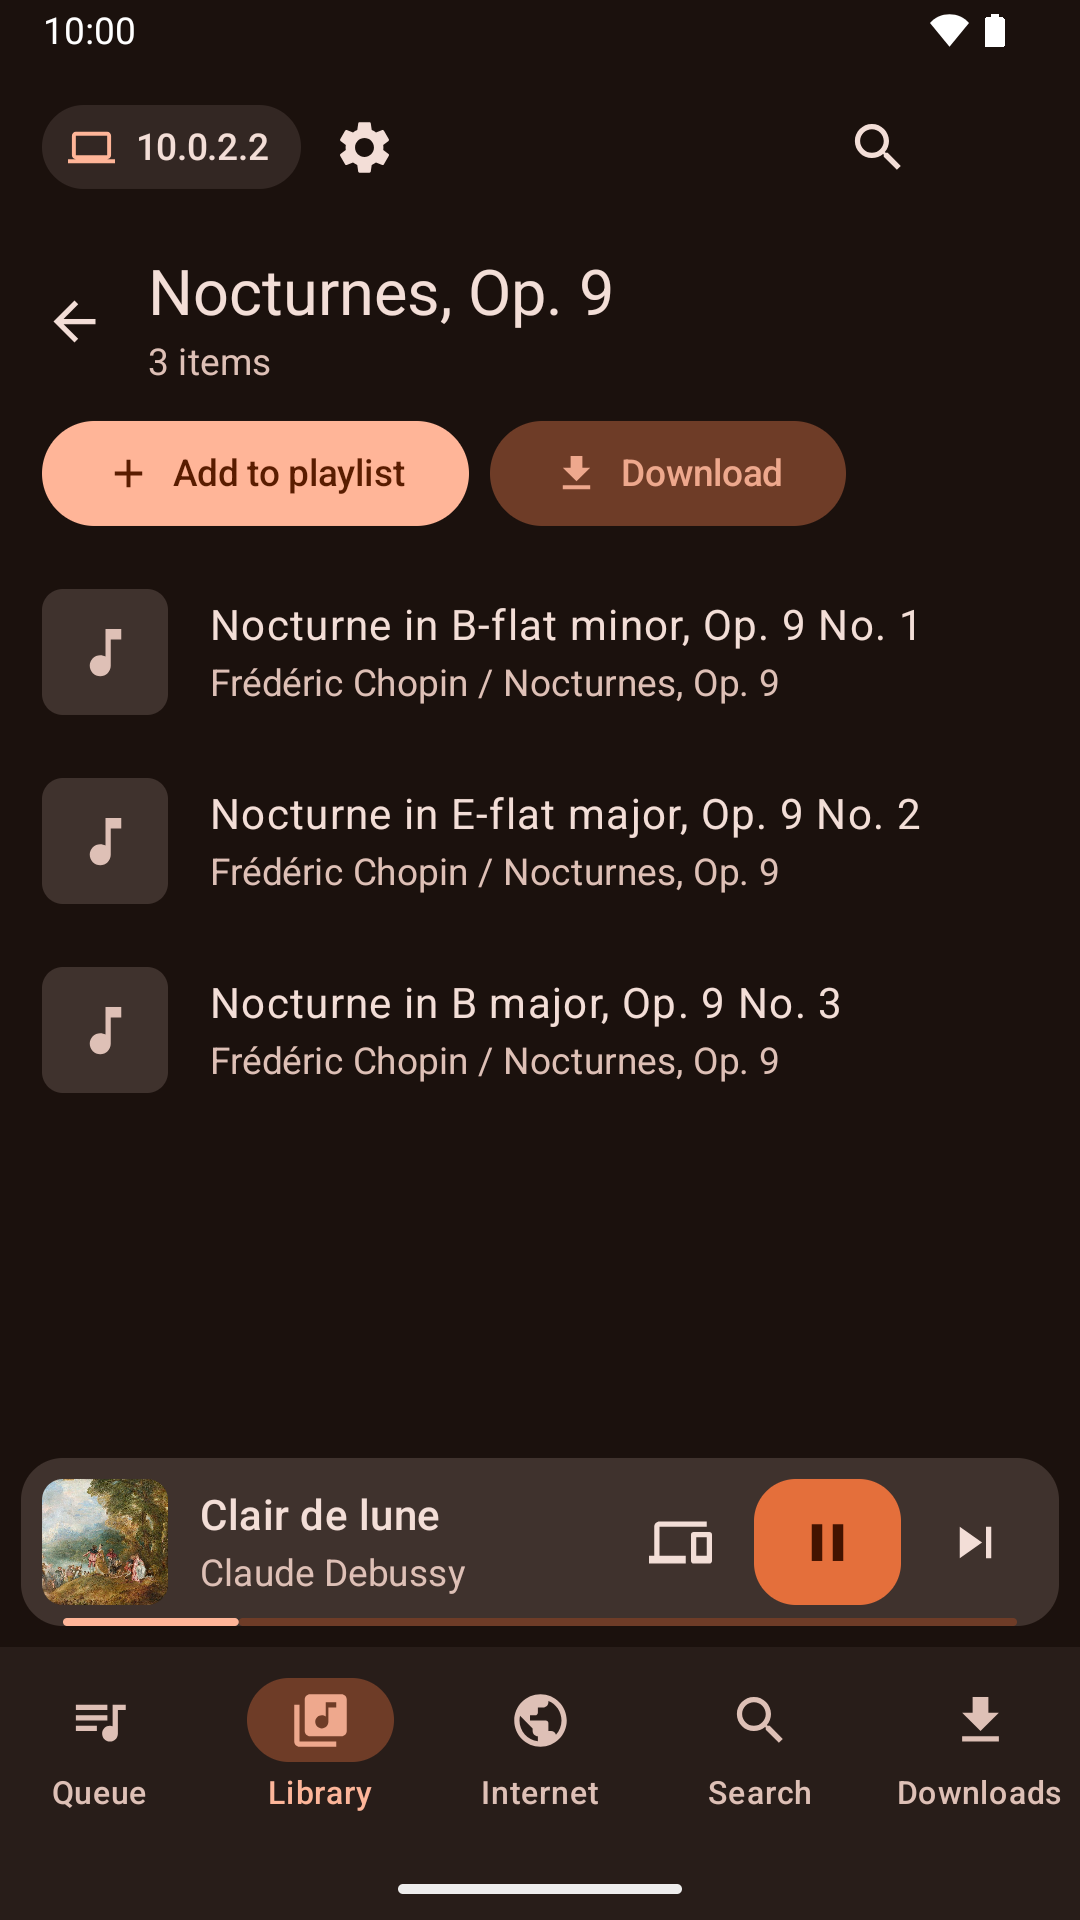
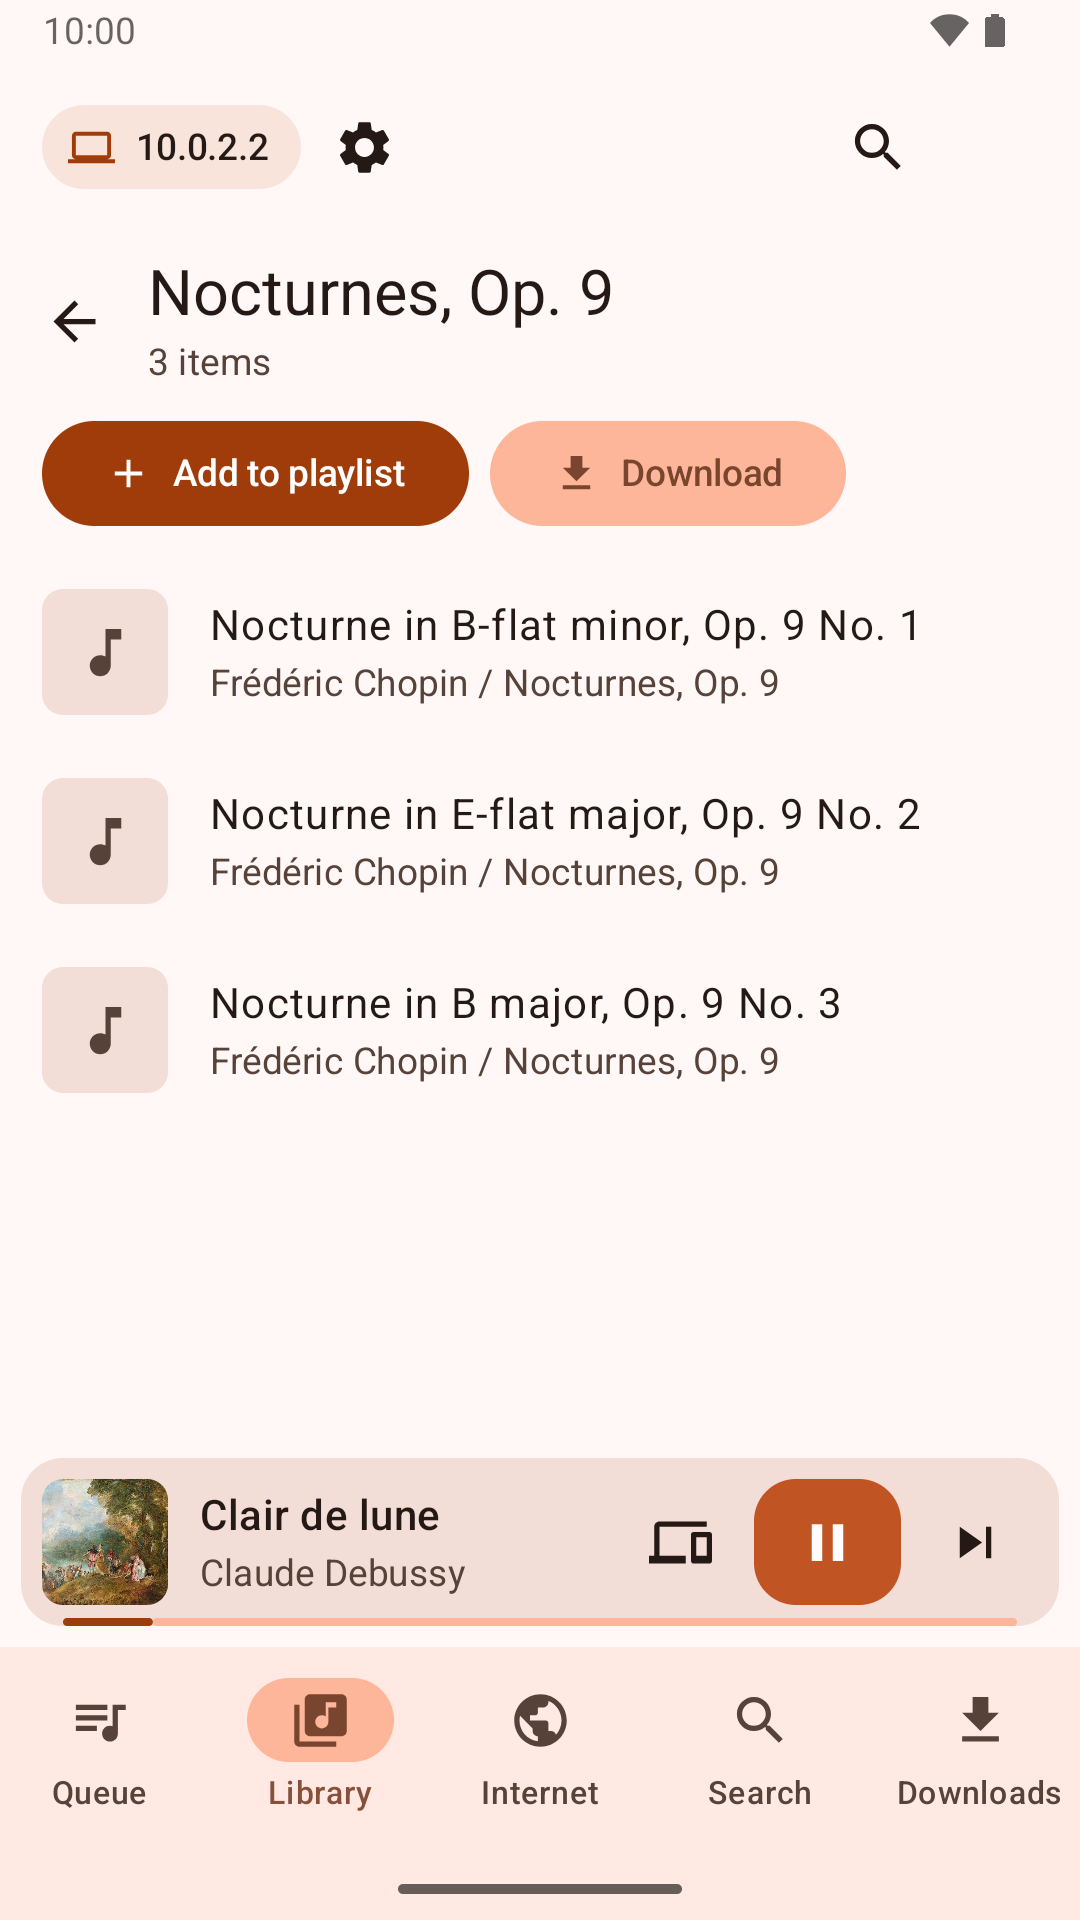
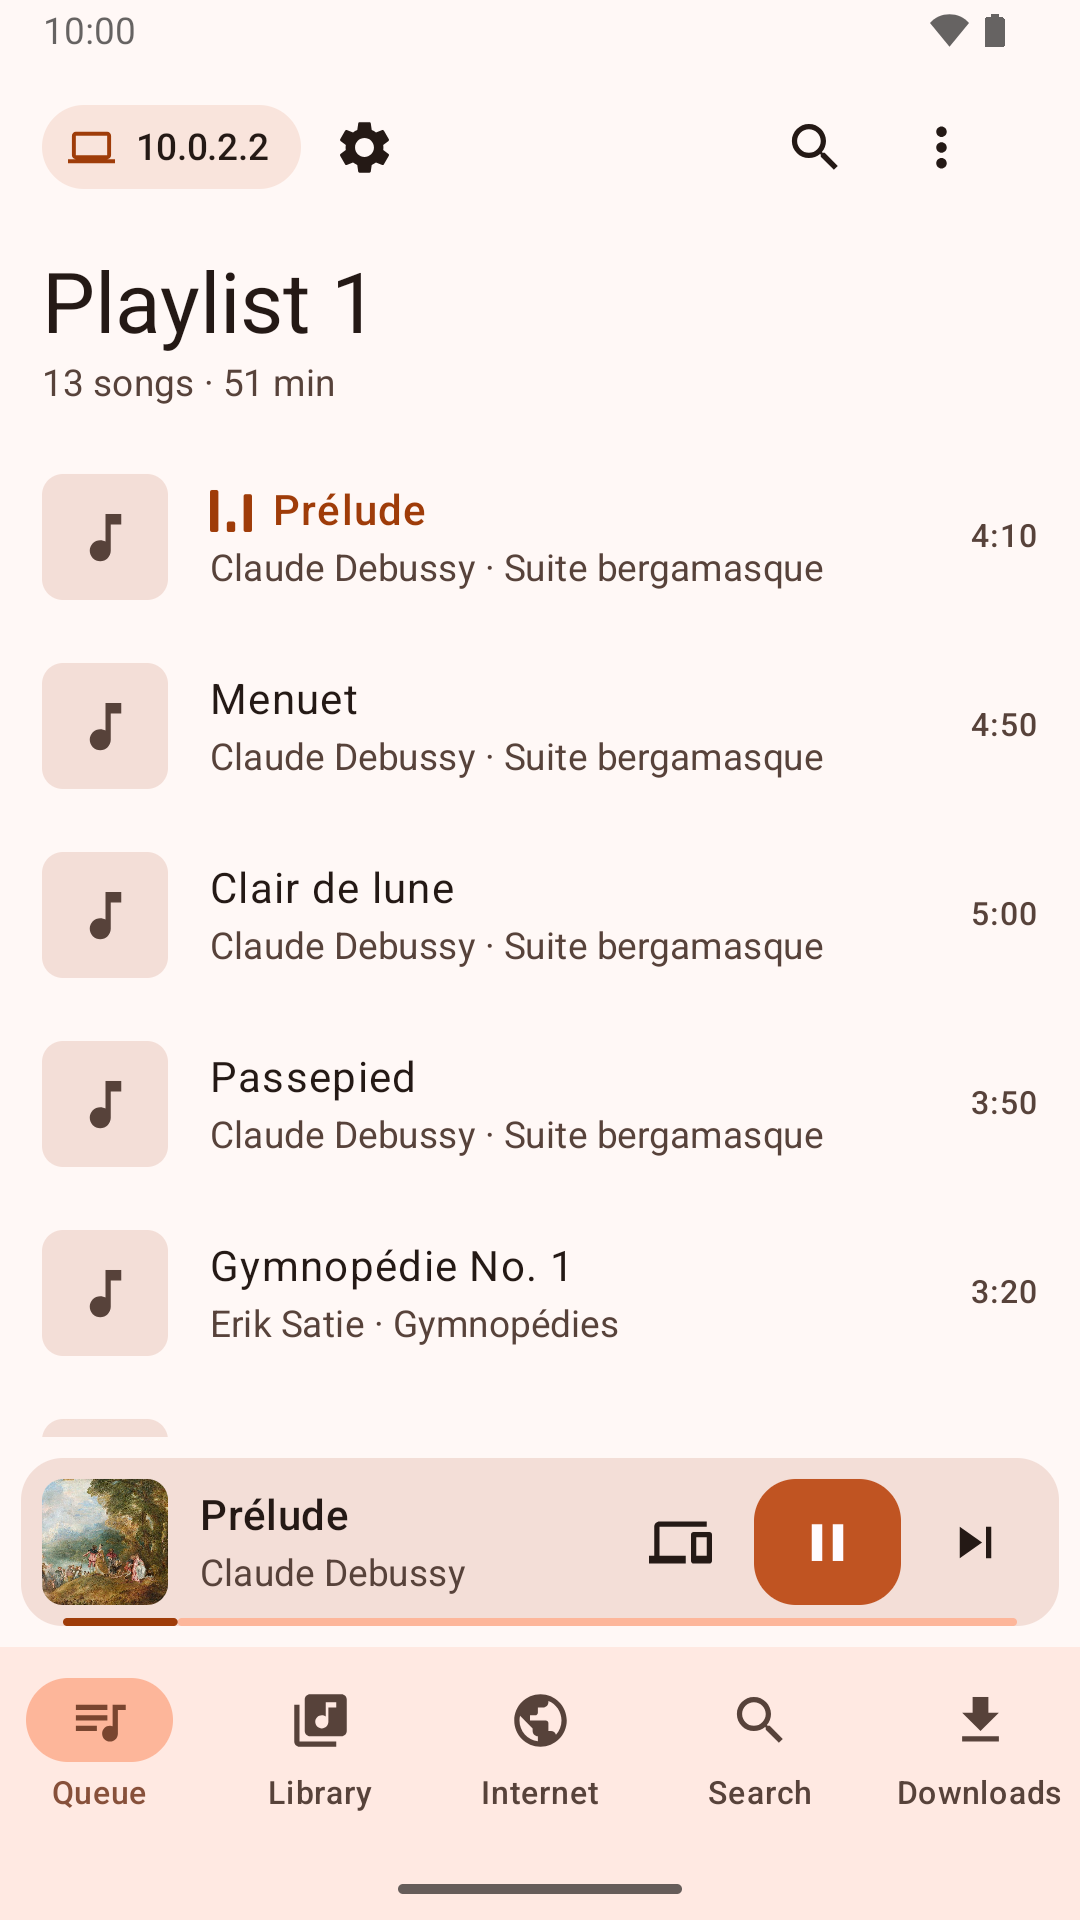
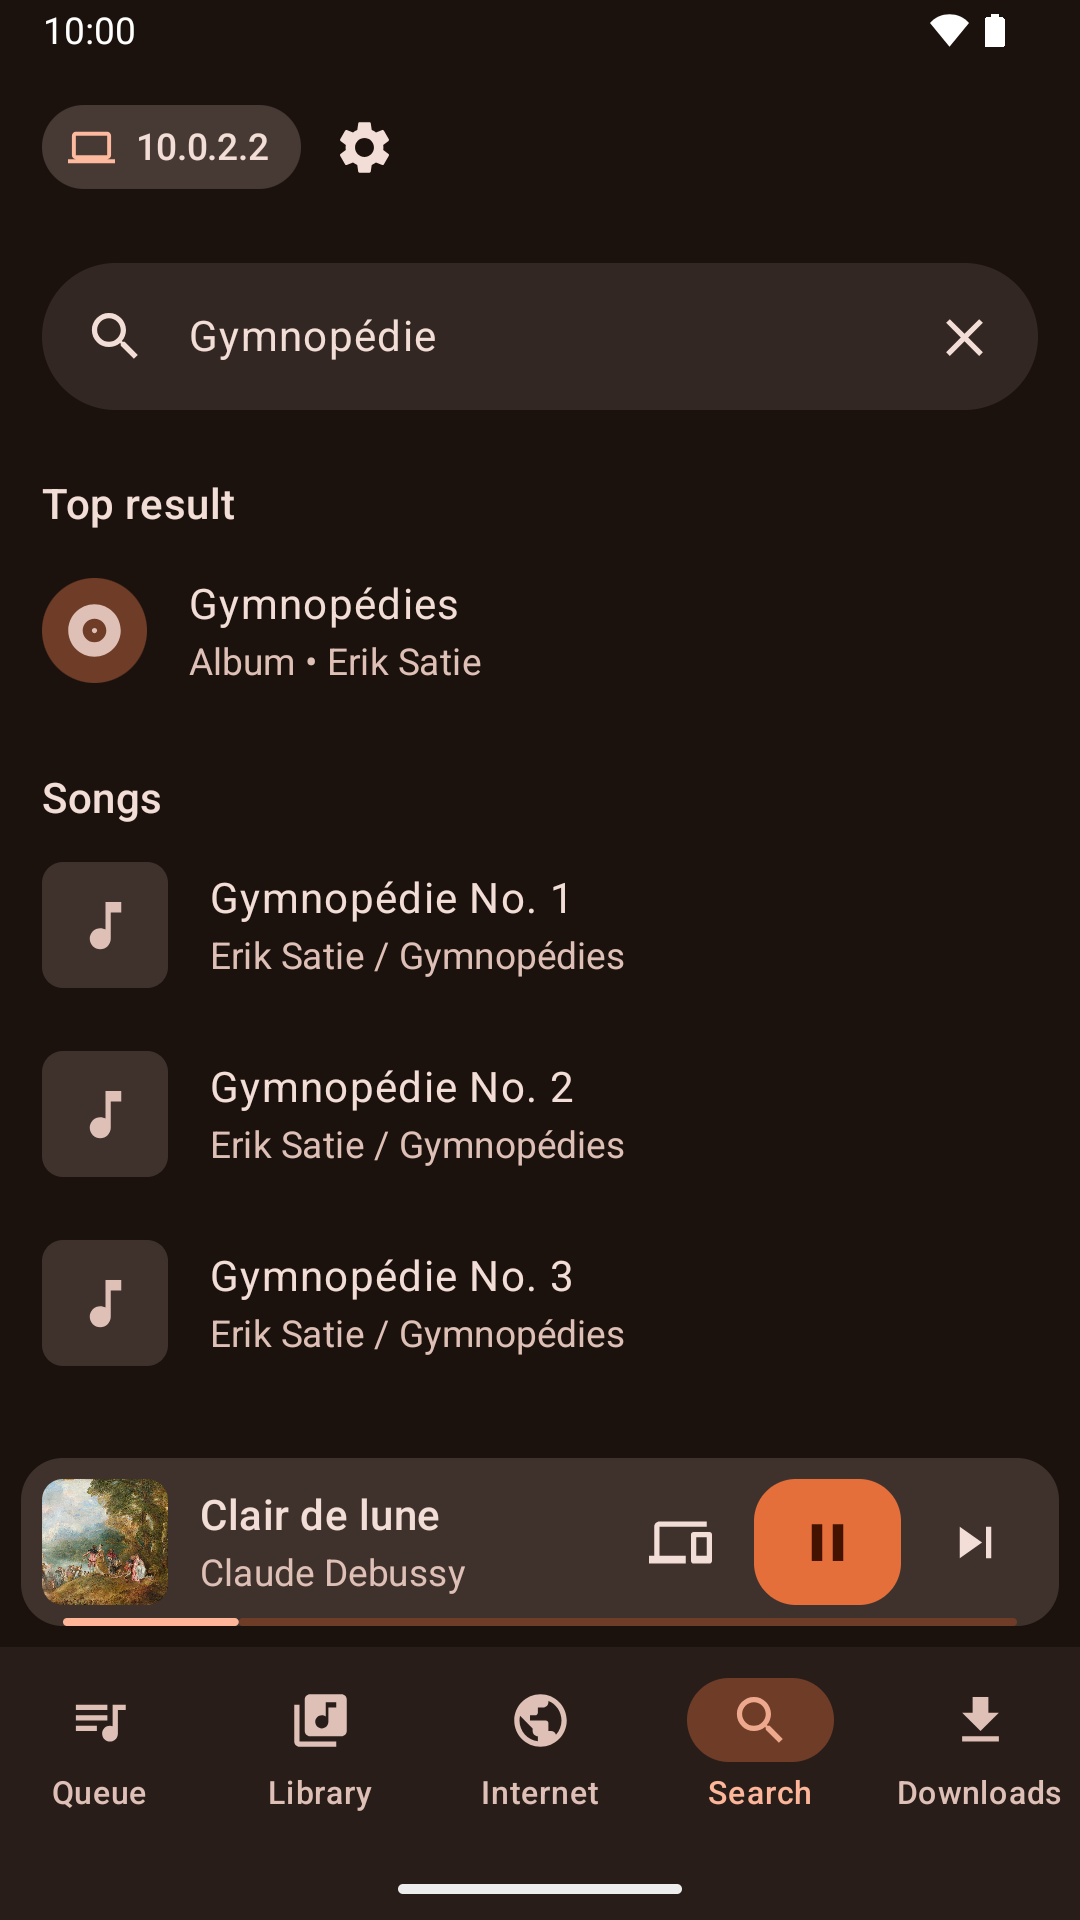
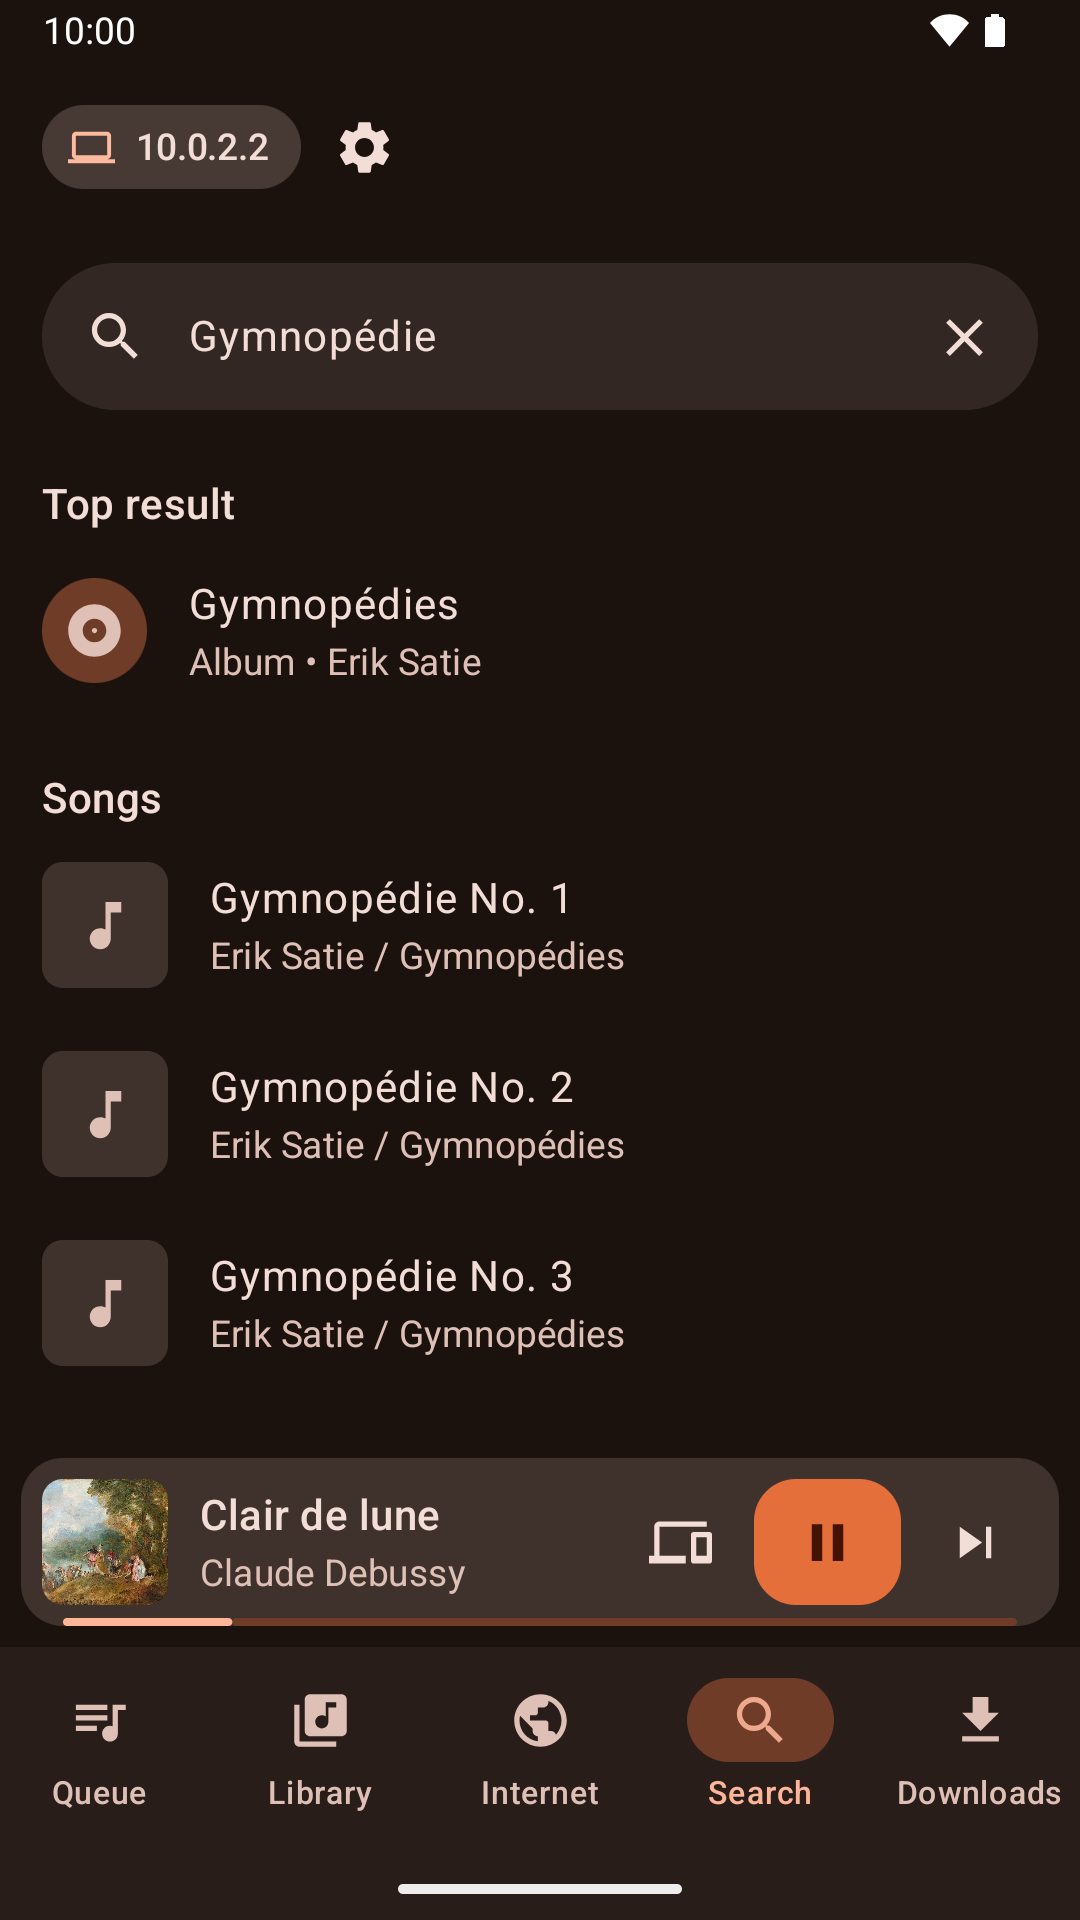
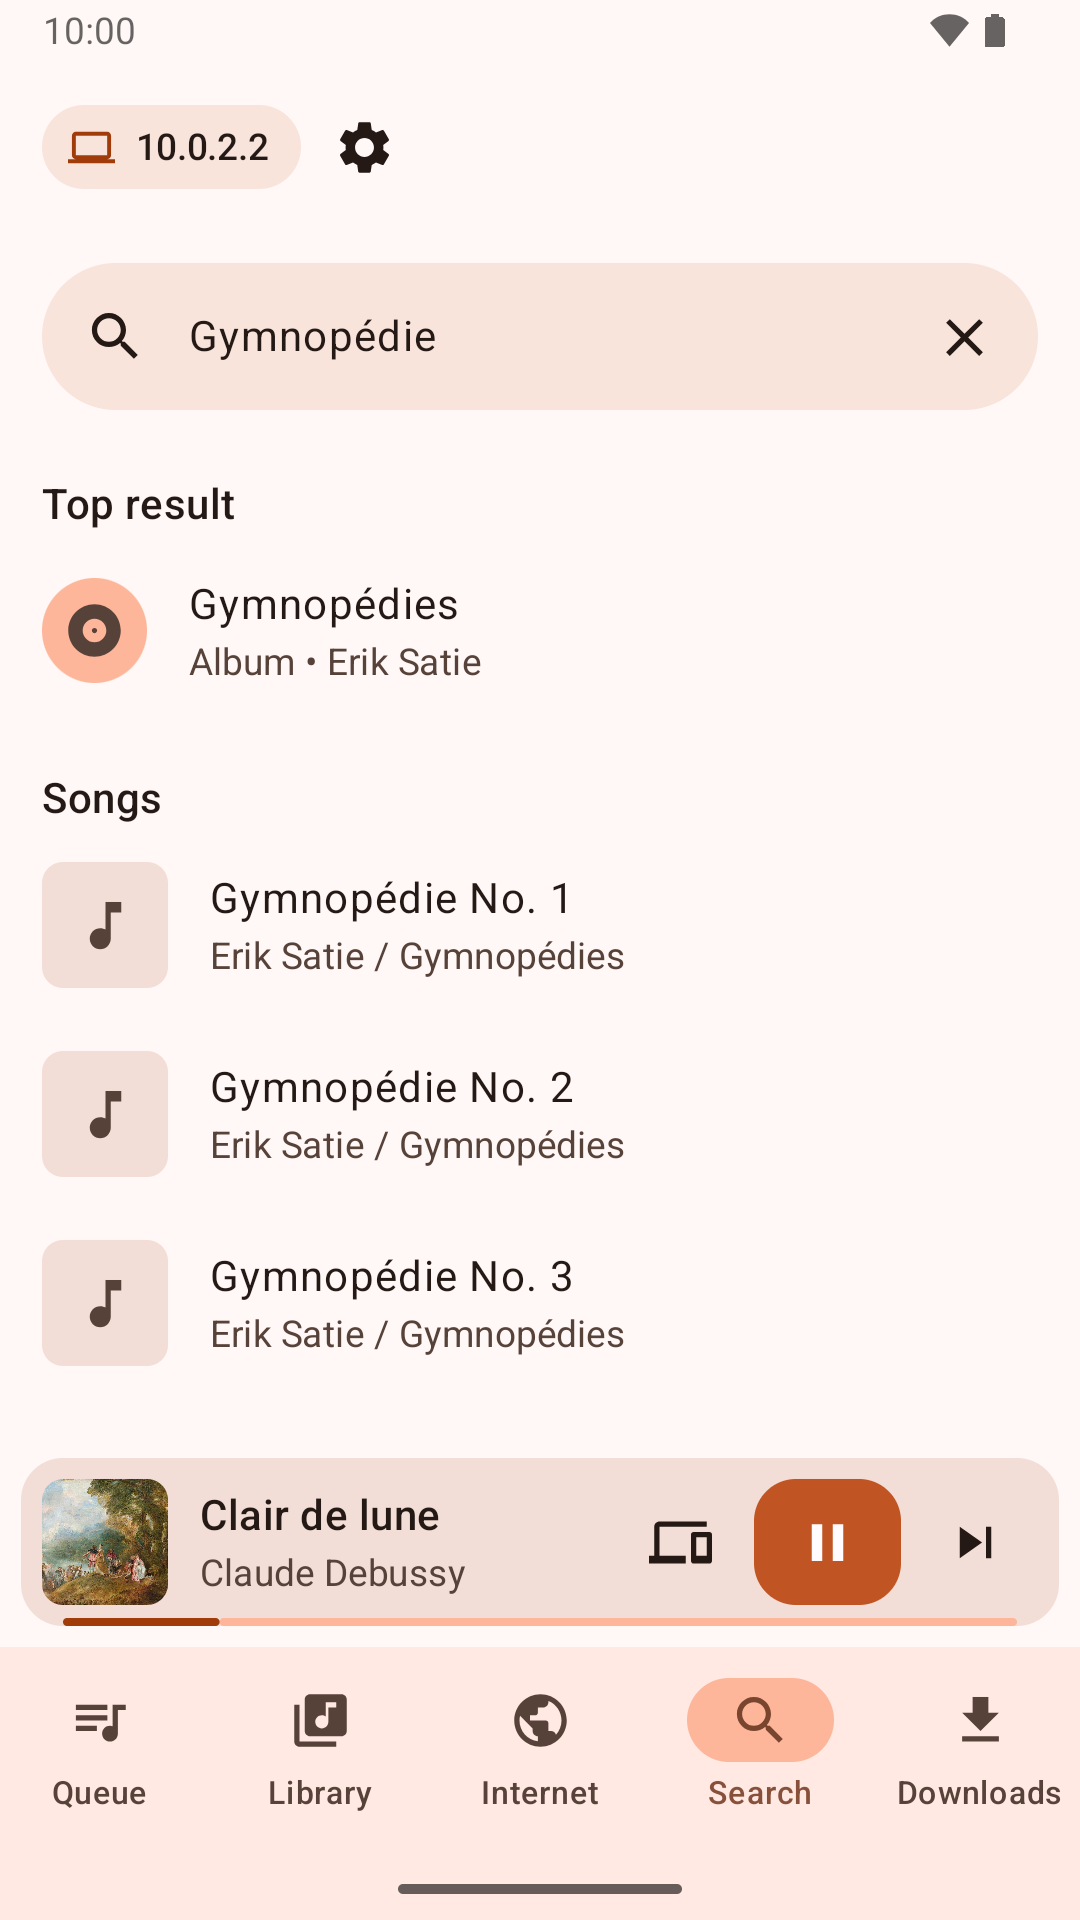
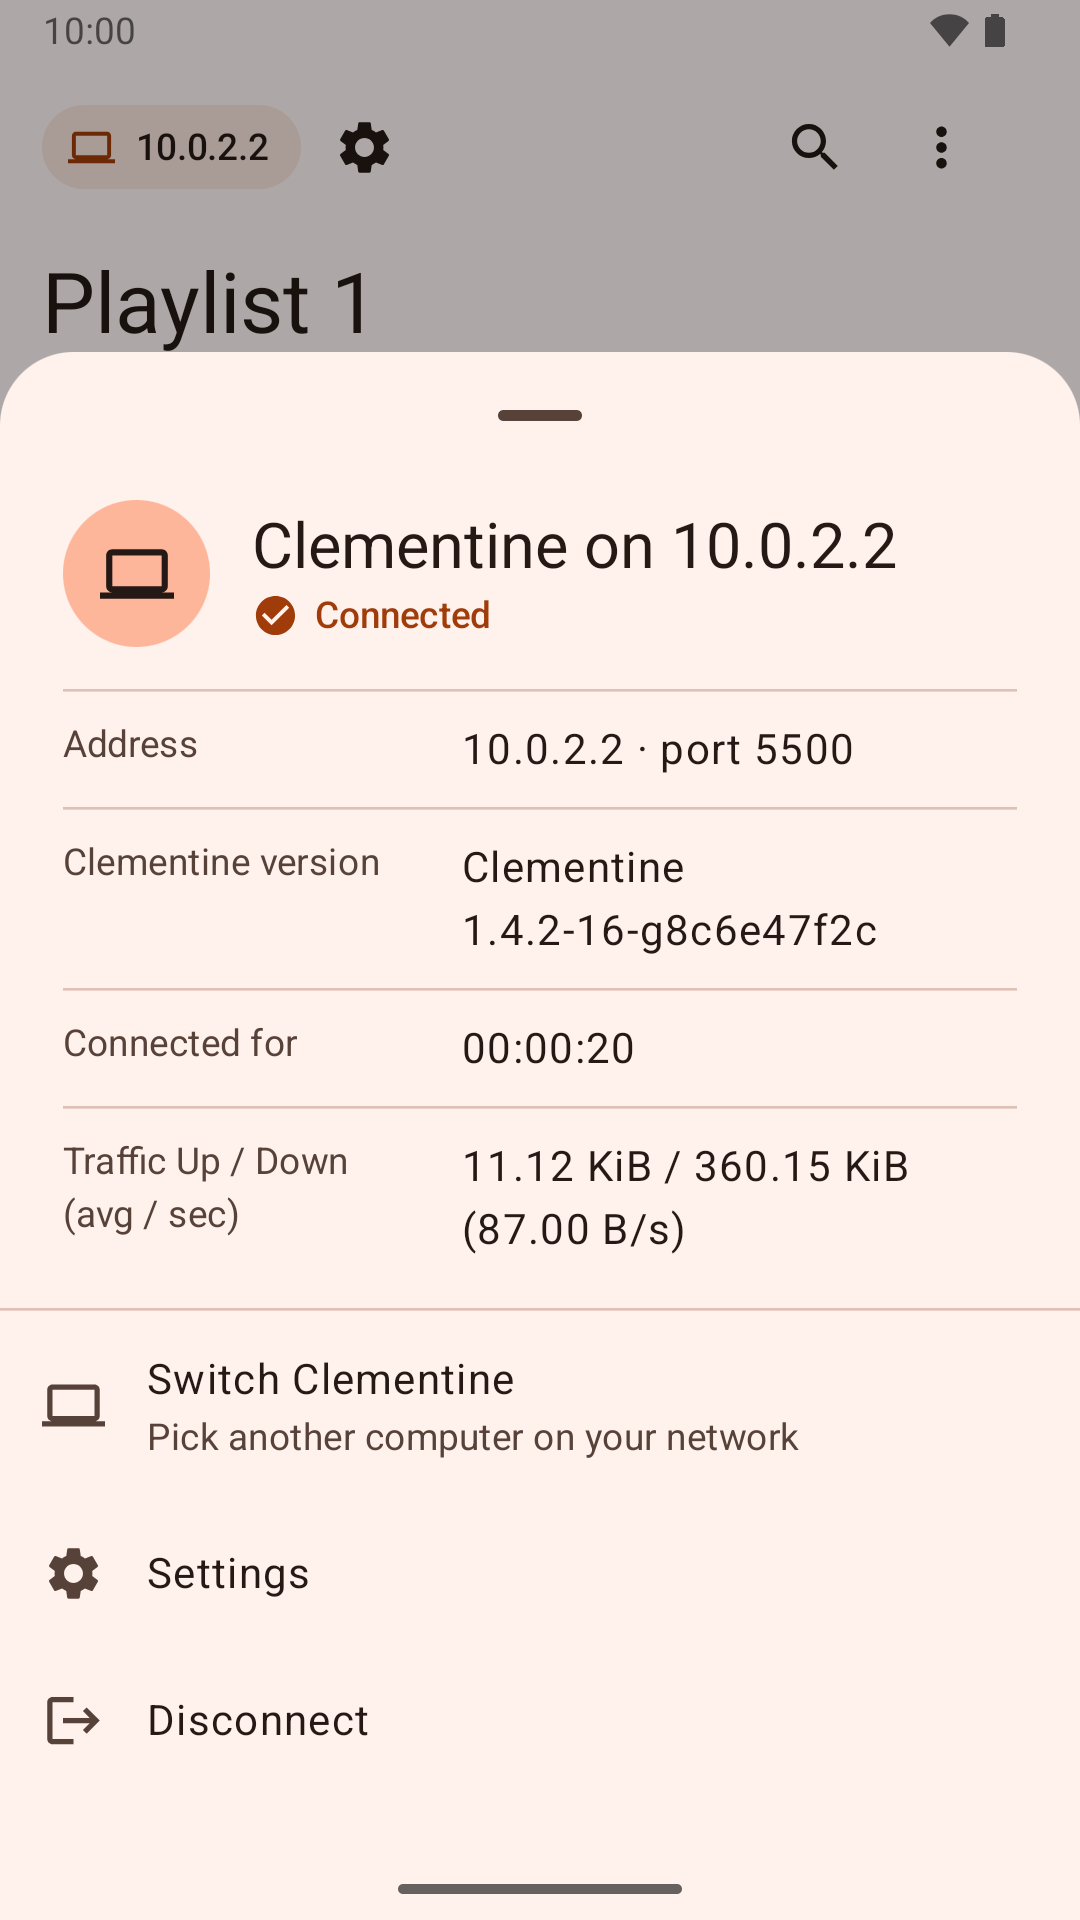
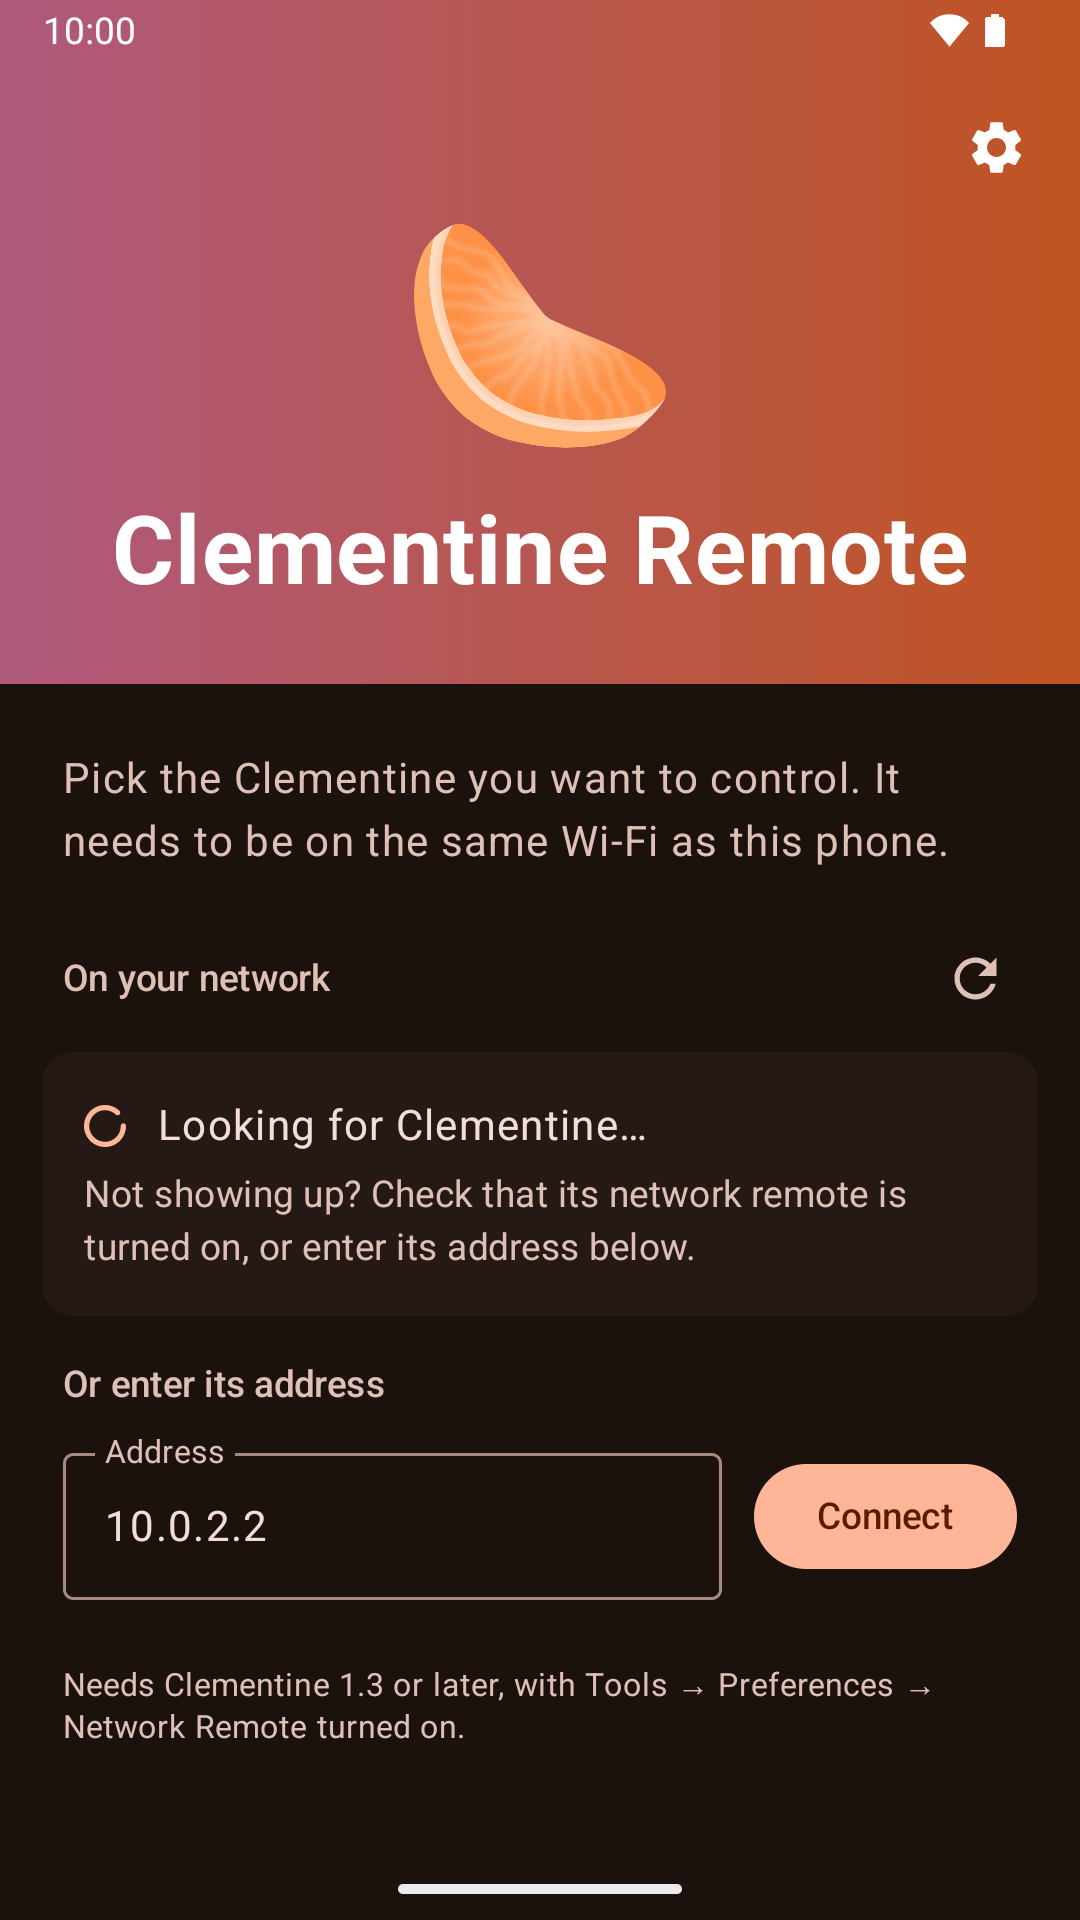
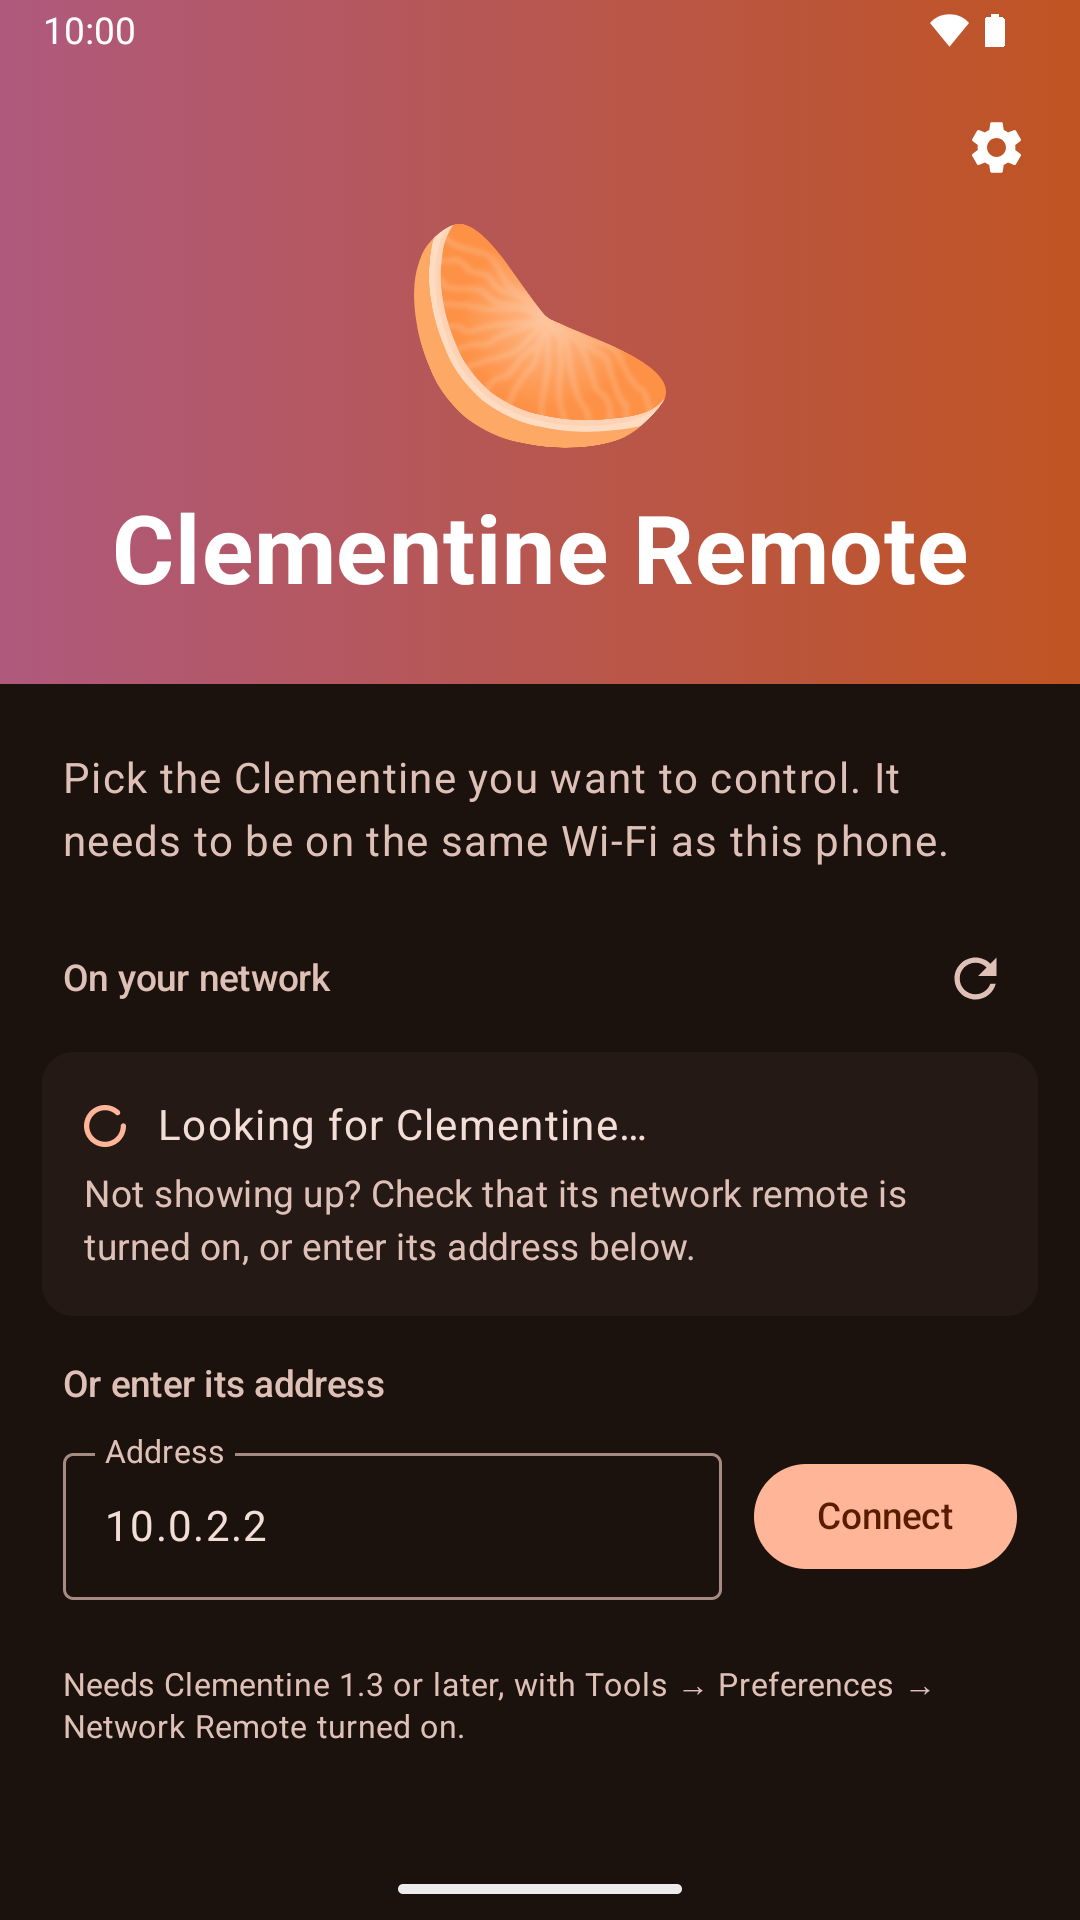
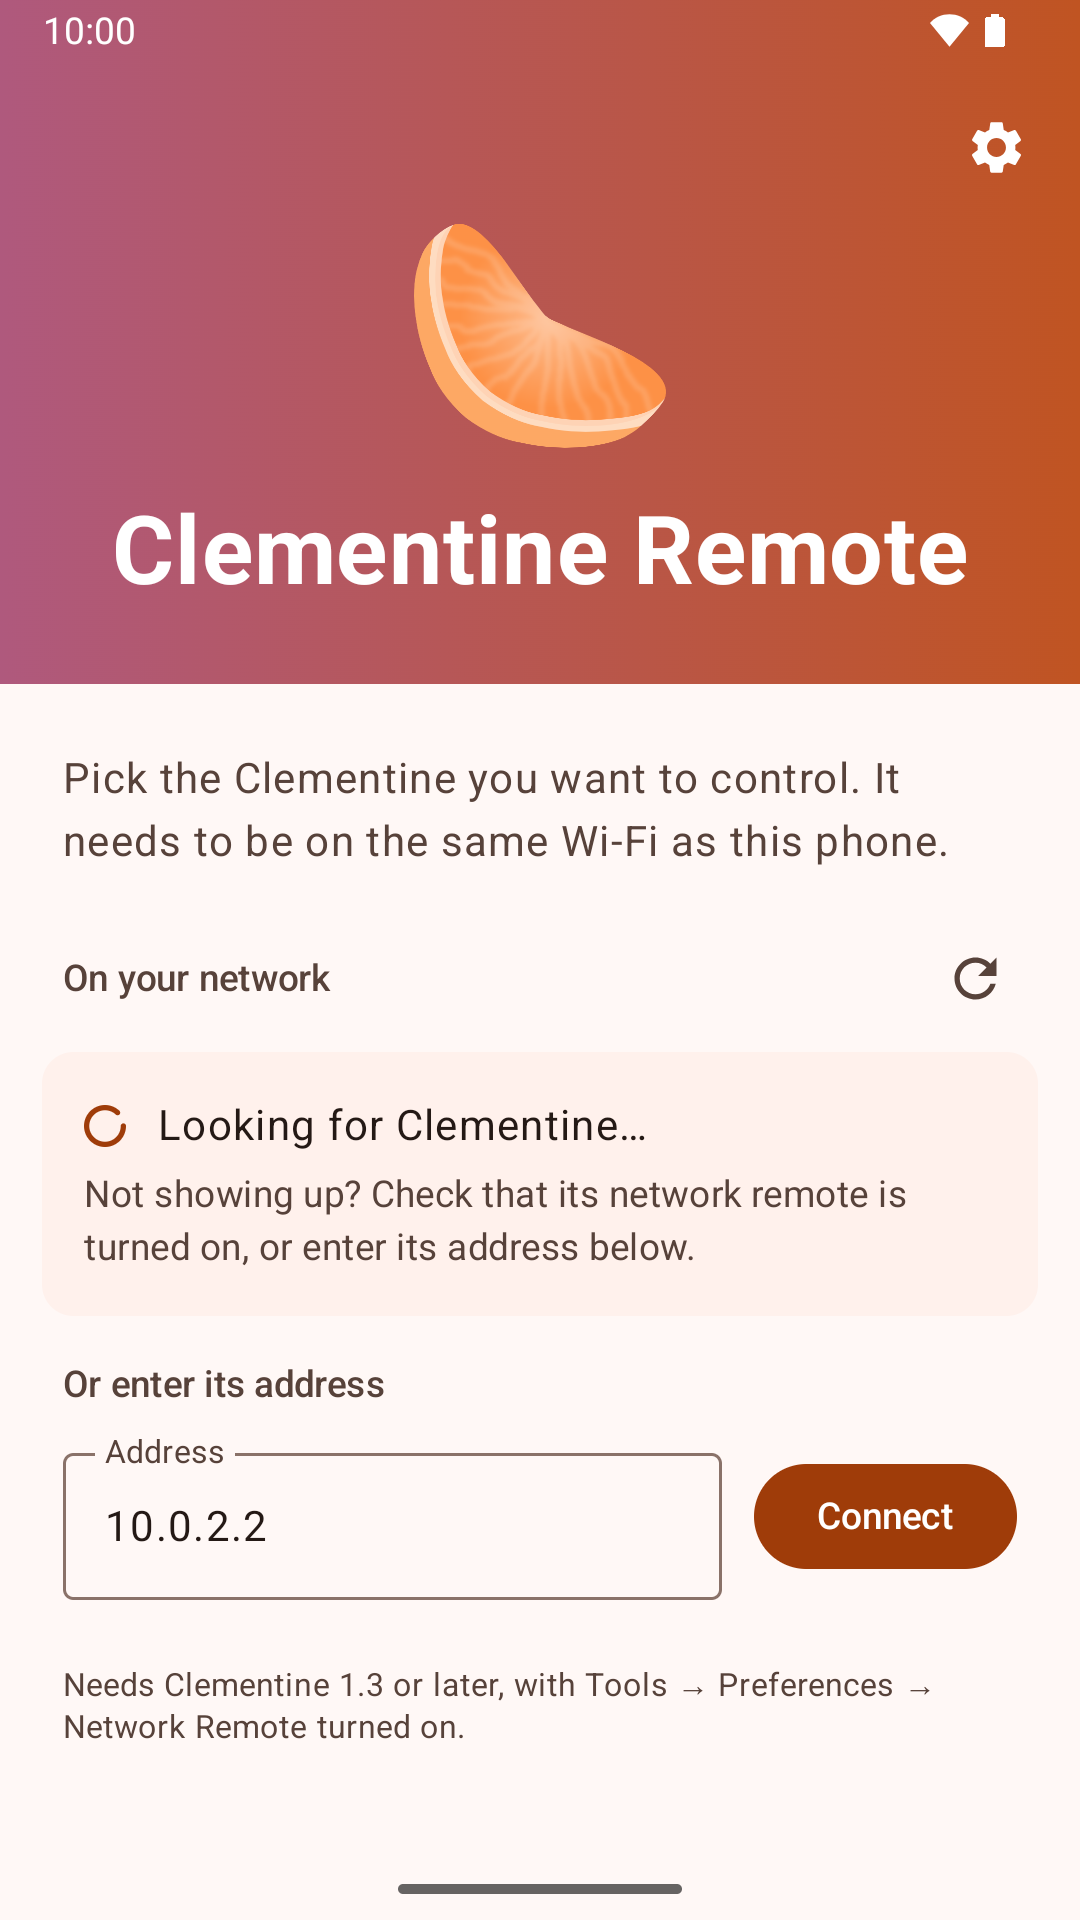
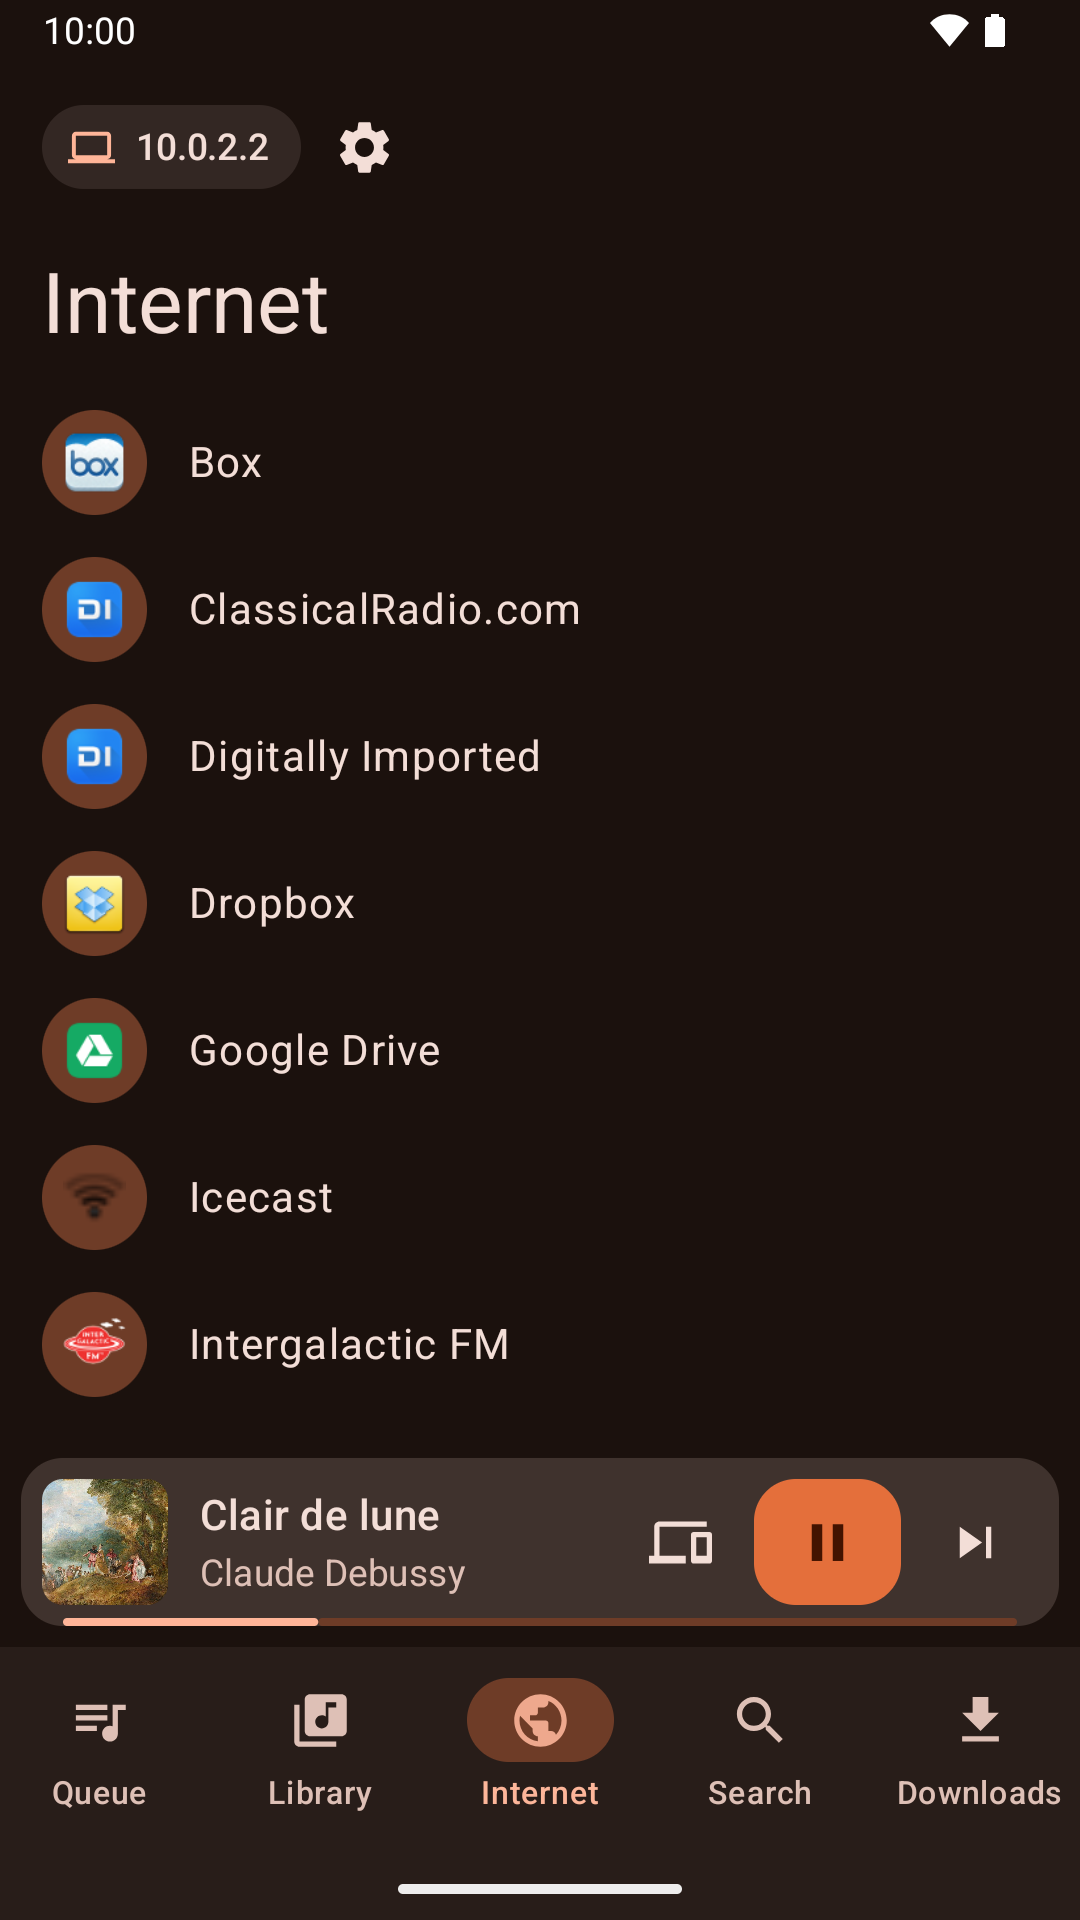
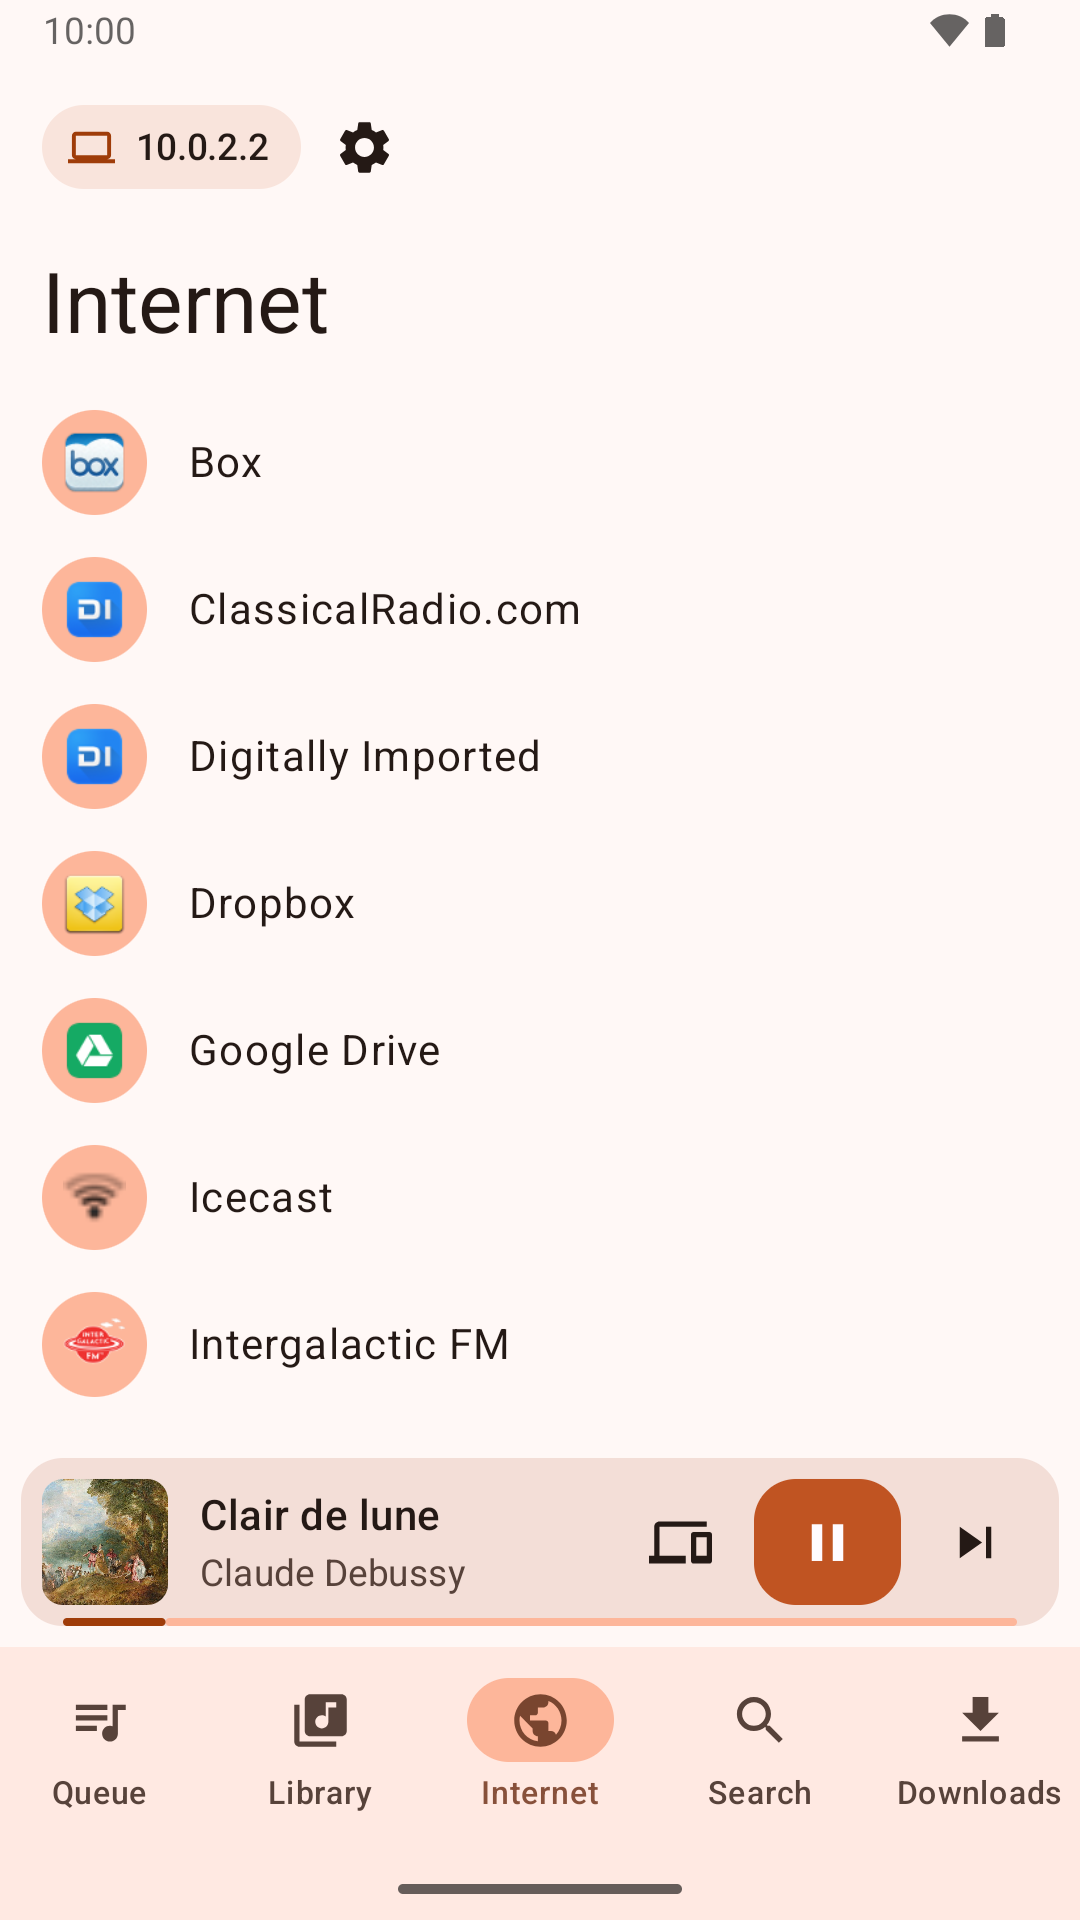
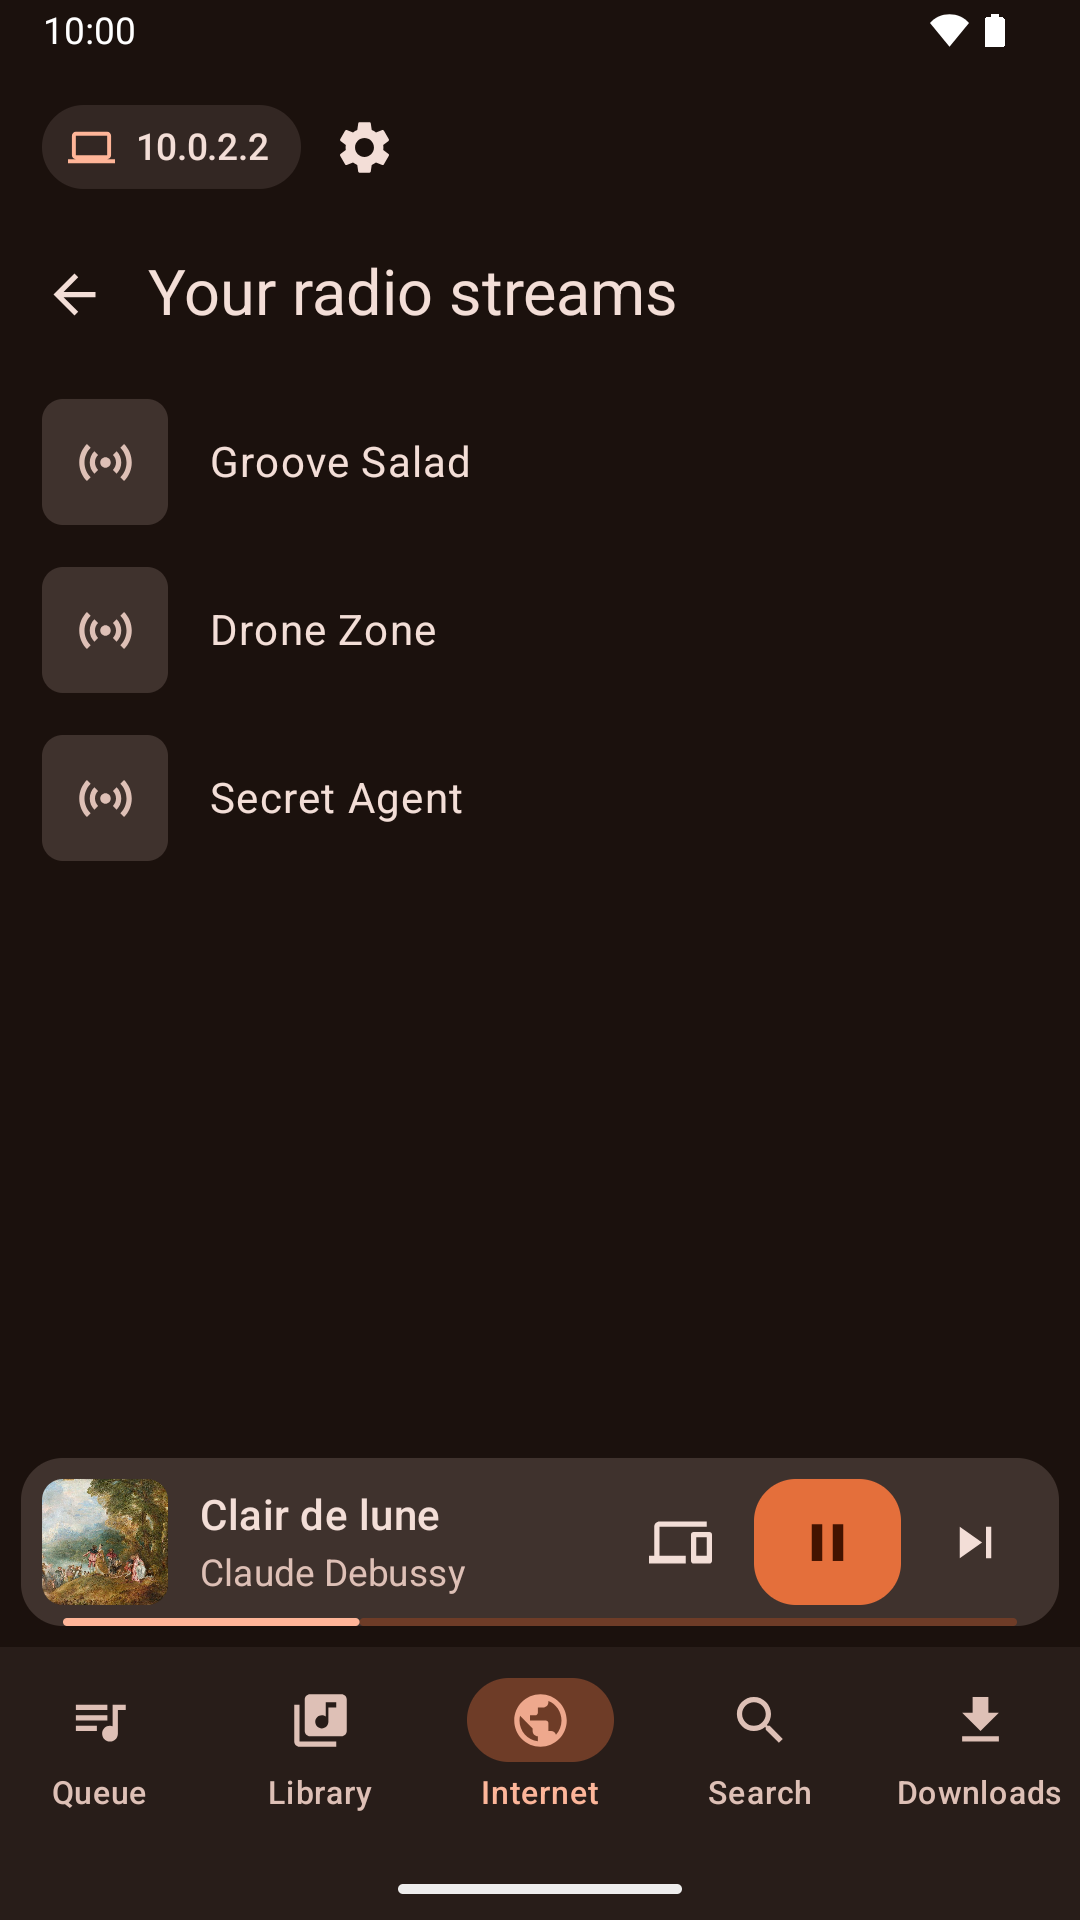
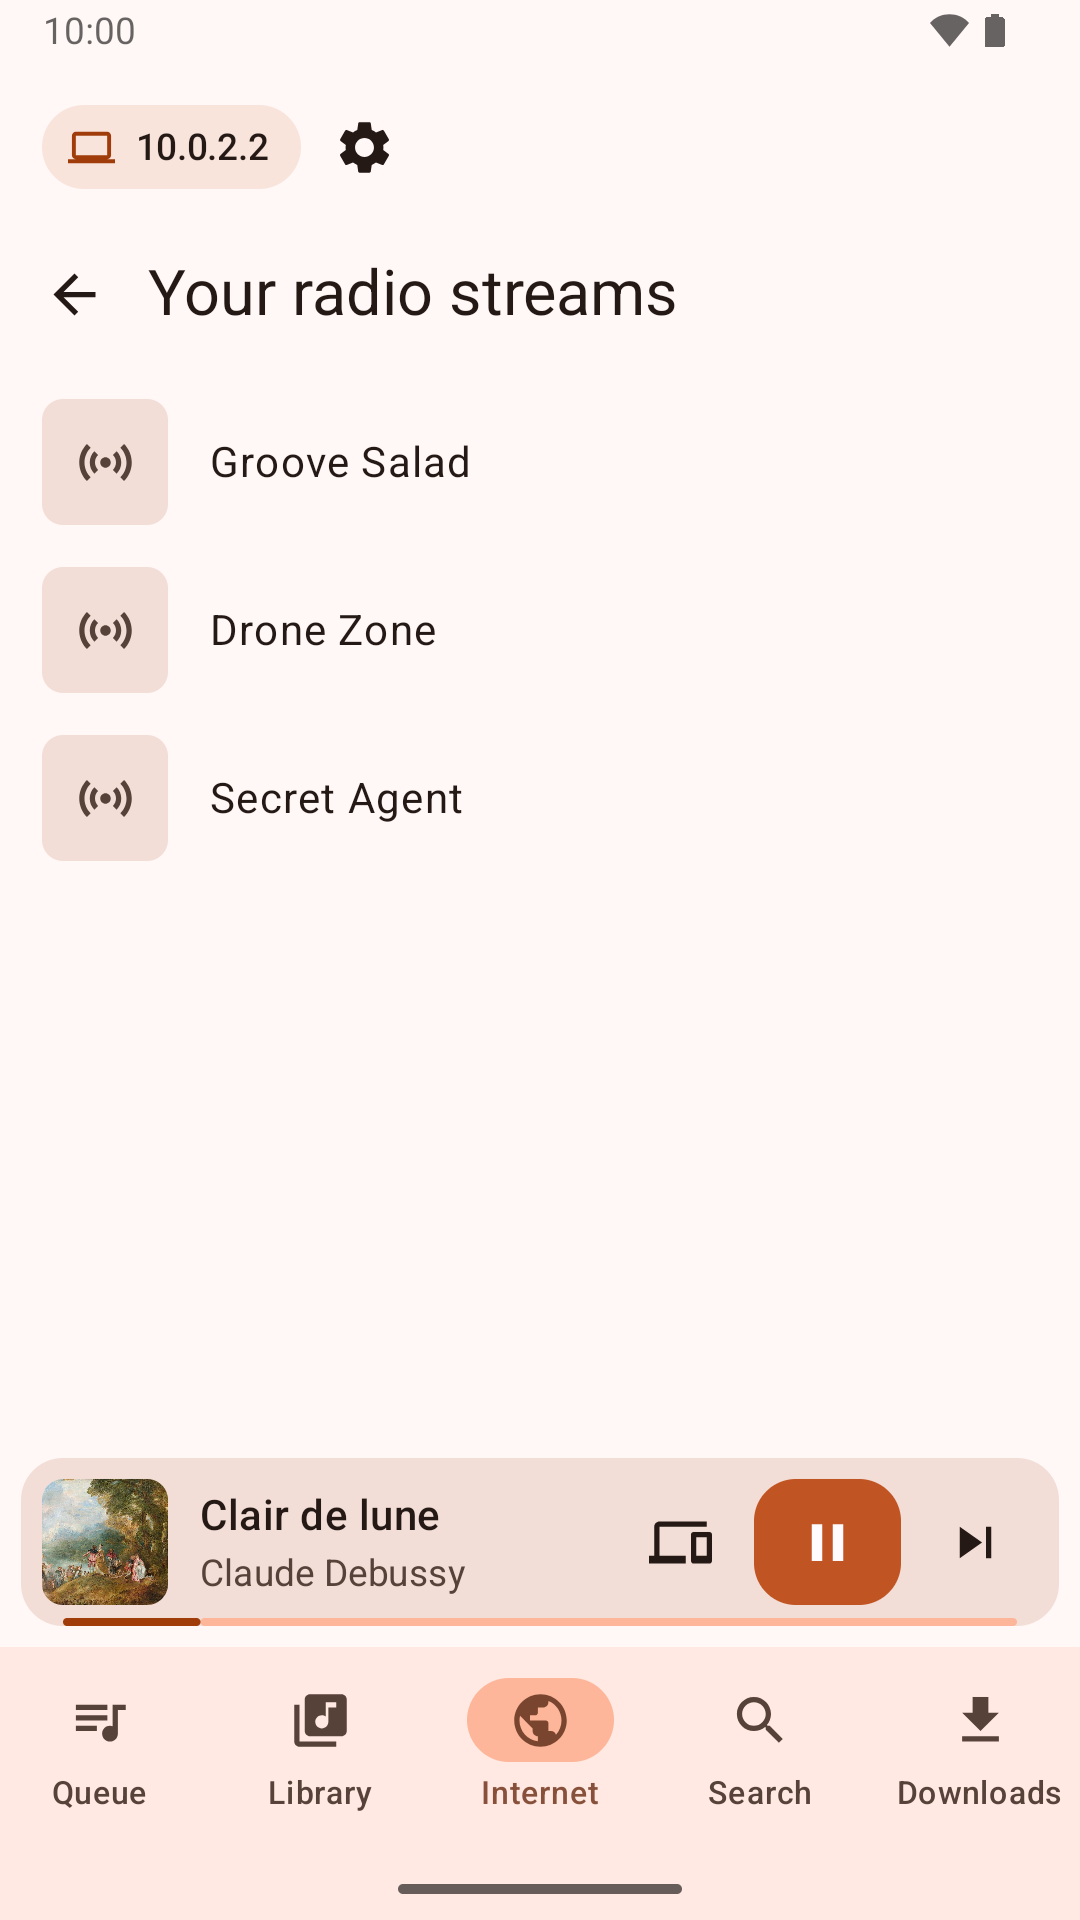
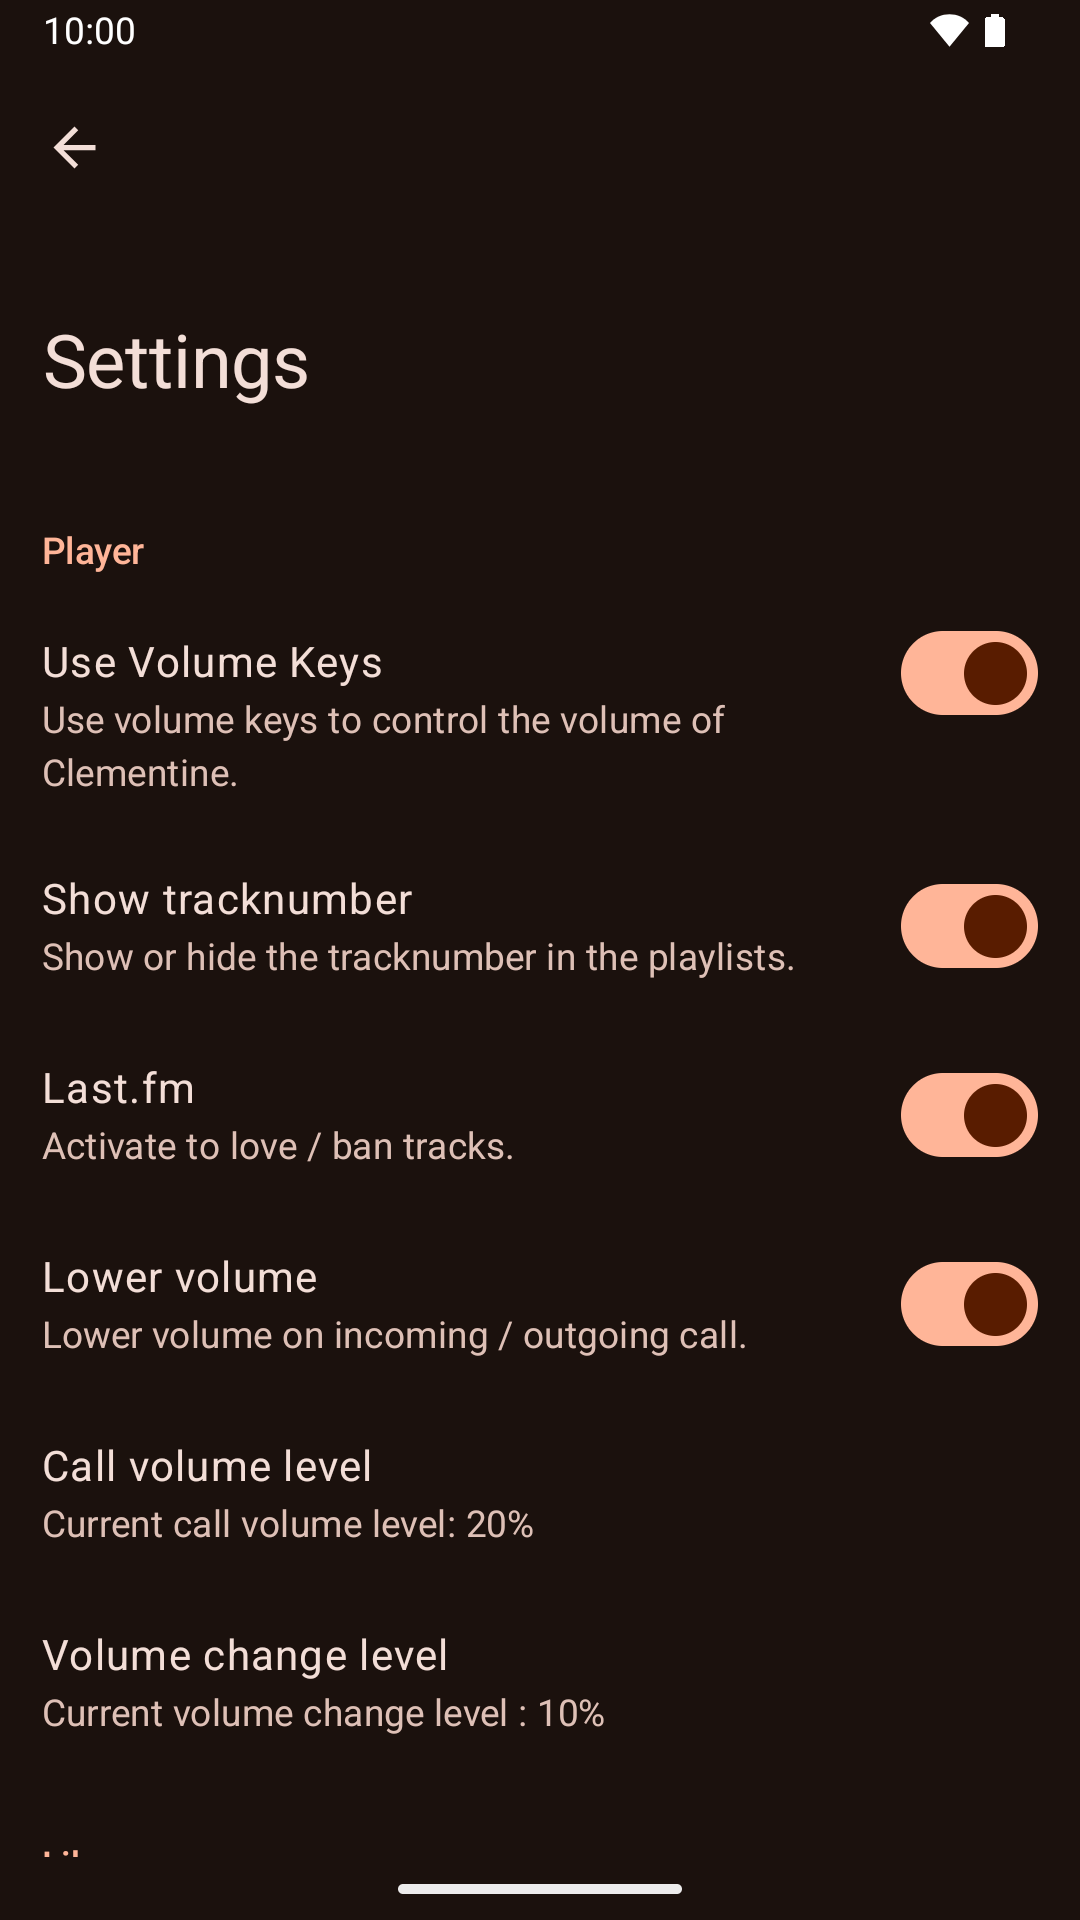
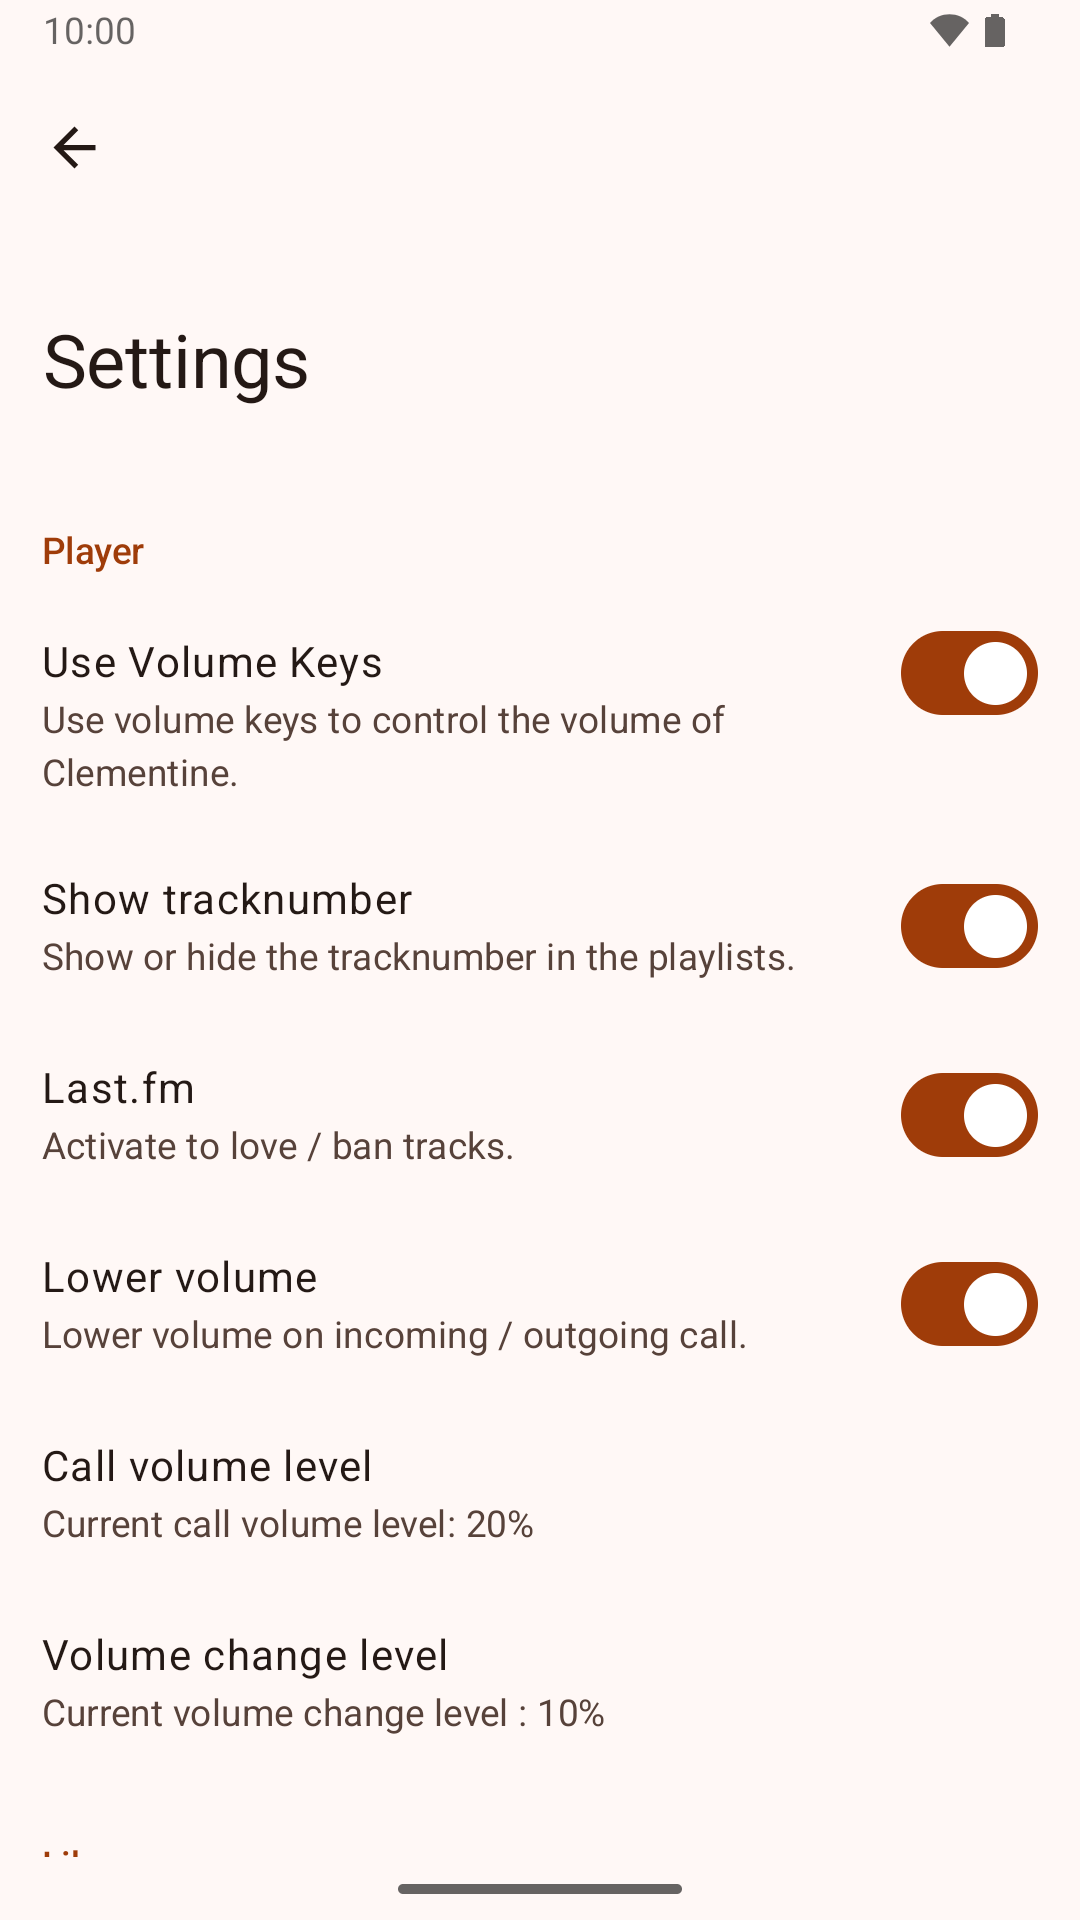
Store screenshotsFrom run 37342449972, against clementine-it. Left: the store listing of the latest release, v13.7, which shows the dark theme. Right: this pull request, dark and light.
|






2 participants


The connection sheet's "(avg / sec)" was total bytes since connecting ÷ seconds since connecting. After streaming stopped it only fell off as 1/t: 5 minutes at 400 KB/s then 5 idle minutes still read about 200 KB/s.
It's now the rate over the last five seconds. The sheet already reads the byte counts twice a second, so
TrafficRatekeeps the readings from the last five seconds and divides the bytes between the oldest and newest by the time between them. The rate reaches 0 within five seconds of traffic stopping. It's left out for the first half-second after the sheet opens, until there are two readings to compare. The totals are still since connecting.Same change on iOS: clementine-player/iOS-Remote, branch
claude/traffic-moving-average, with the same release note.Tests:
TrafficRateTest. Not built here: the session had no Android SDK, so CI is the first build.🤖 Generated with Claude Code
https://claude.ai/code/session_01CTf1Z6GAbDbQeNJ5BkewC1
Generated by Claude Code