
One-line matplotlib plots and themes for notebooks and scripts.
kx is a small, plain-Python package with .mplstyle themes, palettes and colourmaps. It needs nothing beyond
matplotlib, numpy and pandas and works offline, so it also runs in Kaggle competition notebooks.
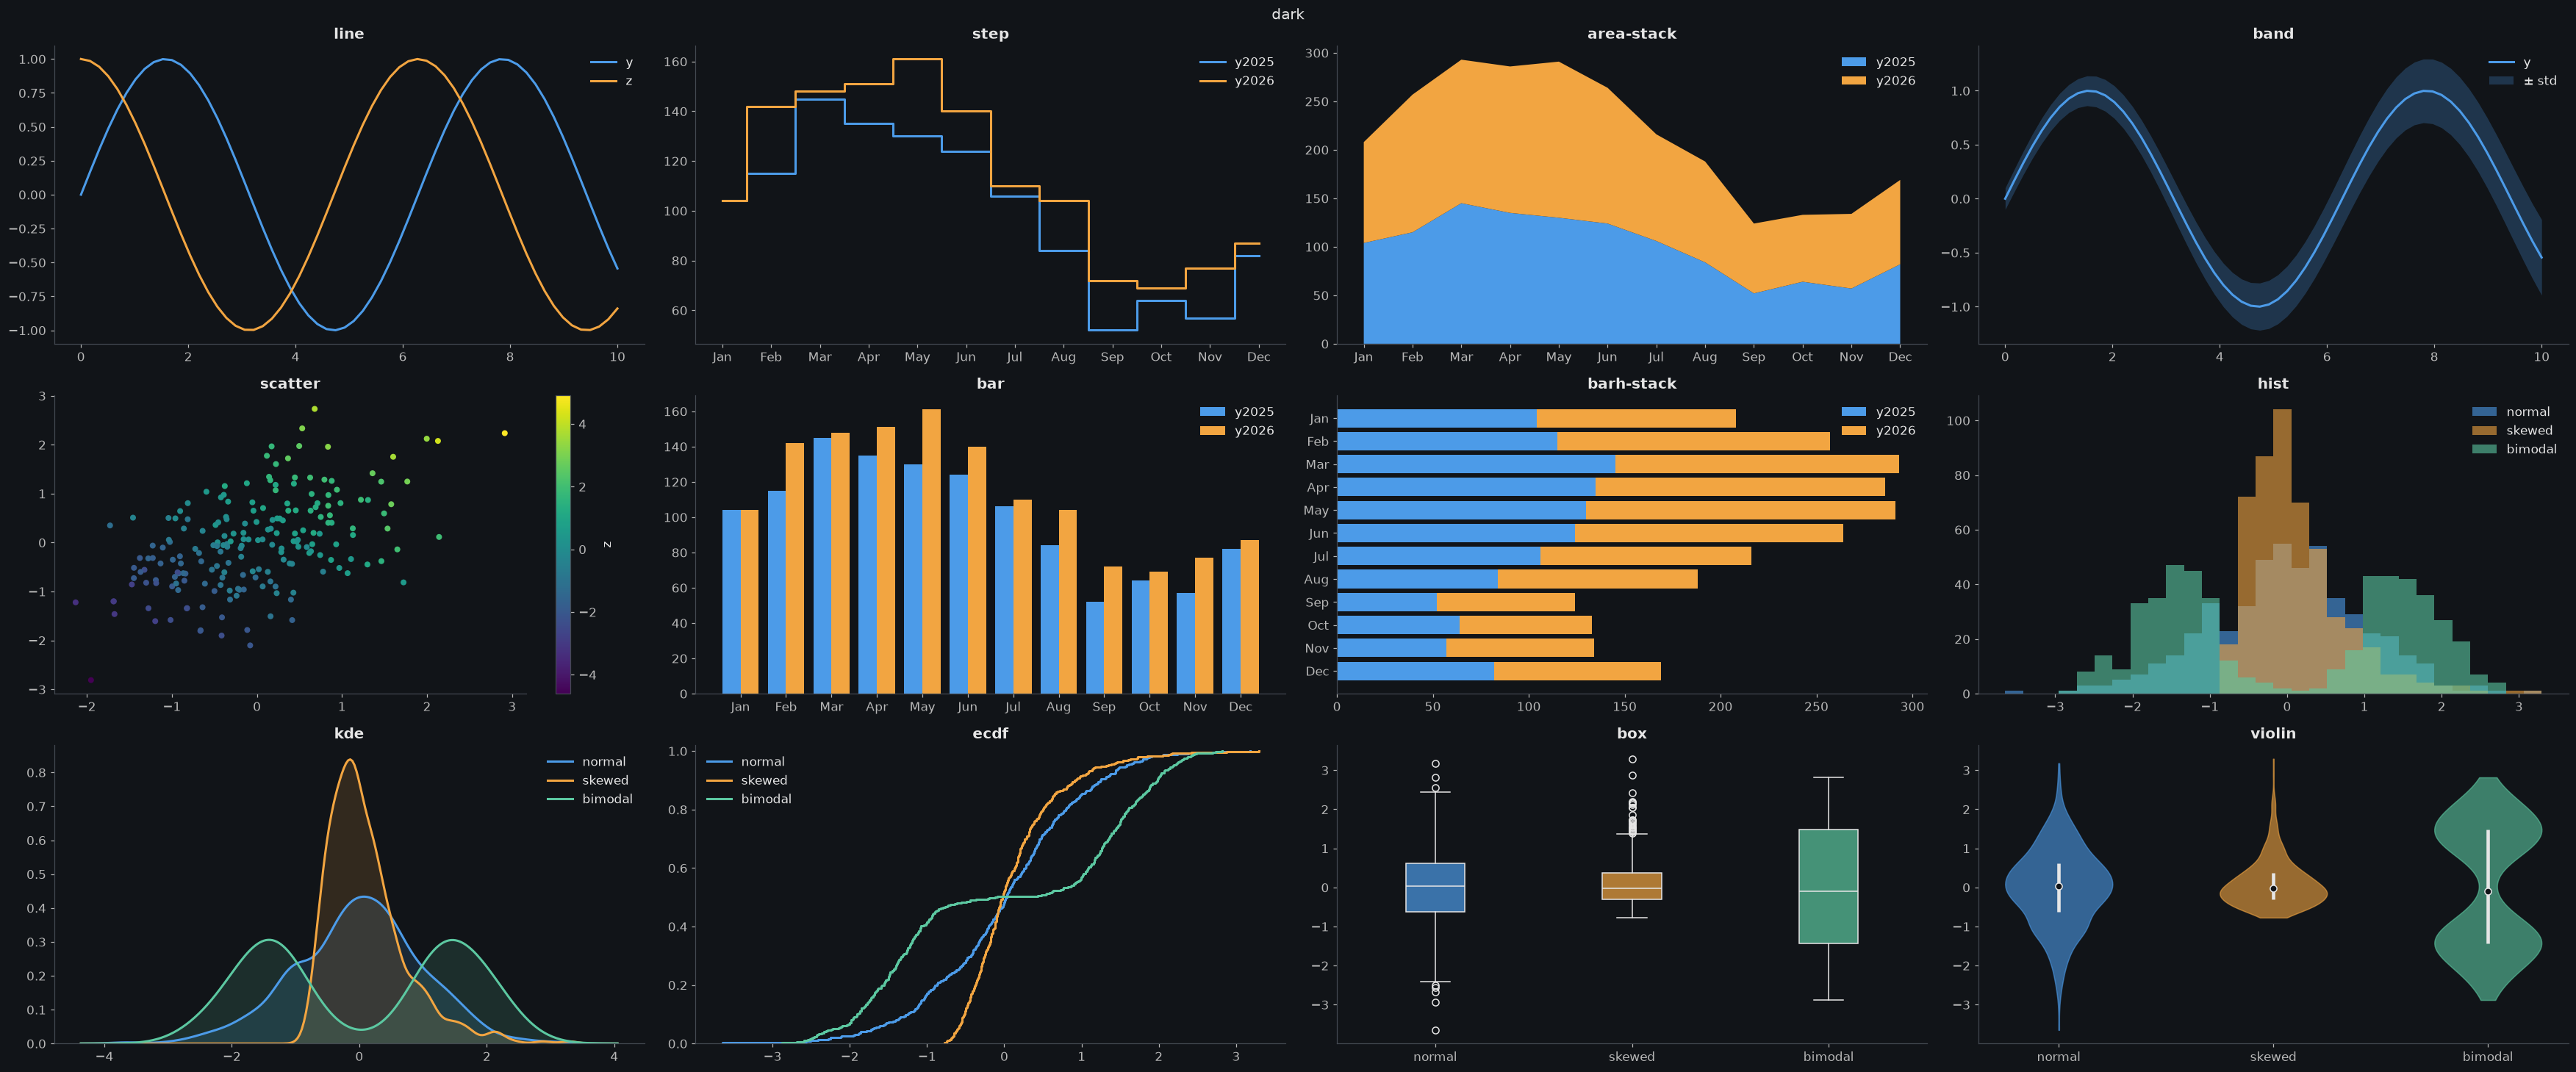
pip install kx-plotimport kx; kx.use('dark')Attach the dataset instead (Add Input → Datasets → vhrabar/kx-plot), then:
import sys; sys.path.append('/kaggle/input/datasets/vhrabar/kx-plot')
import kx; kx.use('dark')kx.use('light', palette='okabe', cmap='cividis') # notebook default: theme, palette, colormap
kx.plot(x, y, z, 'scatter-grid-leg') # spec: kind-theme-flag-...
kx.plot(x, y, 'bar-paper') # a theme in the spec applies to this plot only
kx.plot(df.value, spec='kde', by=df.group) # one density curve per group
kx.plot(df.value, spec='box', by=df.group) # one box per group (also ecdf, violin)| Token | Values |
|---|---|
| kind | line step area band scatter bar barh hist kde ecdf box violin |
| theme | dark light paper science talk poster thesis |
| flags | grid leg logx logy tight, plus stack norm cum (below) |
stack works with area, bar, barh and hist. norm is a 100% stack for area and a
density (area 1) for hist. cum makes hist cumulative; hist-norm-cum is the CDF.
hist puts every series on the same bins, so the bars line up.
Unknown tokens raise an error instead of being guessed. Everything is inspectable:
kx.grammar(), kx.grammar('area'), kx.show('dark'), kx.source('scatter').
rcParams can be overridden in kx.use with __ for dots: kx.use('dark', figure__figsize=(8, 4)).
Every kind, option, flag and config, with its output, is in the Example Usage notebook.
Palettes for kx.use(theme, palette=...), they swap only the colours; a theme's
other cycled properties (such as paper's linestyles) stay.
| Name | Source |
|---|---|
okabe |
Okabe & Ito (2008) |
tolbright tolvibrant tollight |
Paul Tol |
tolhc tolmc |
Paul Tol |
petroff6 petroff8 petroff10 |
Petroff (2021) |
tab10 tab20 tableaucb |
Tableau |
set1 set2 dark2 paired |
ColorBrewer |
ibm |
IBM Design Colors |
kx.palette('okabe') returns the hex codes. A list of colours works too: palette=['#264653', '#e9c46a'].
Colourmaps for kx.use(theme, cmap=...) colour continuous values, such as a numeric z in scatter.
Without cmap, the theme's own default applies.
Add _r to any name to reverse it, e.g. cmap="thermal_r".
| Name | Type |
|---|---|
viridis magma plasma inferno cividis |
Sequential, perceptually uniform |
turbo |
Sequential, rainbow |
coolwarm |
Diverging |
berlin managua vanimo |
Diverging, dark centre |
twilight |
Cyclic, for angles and phases |
thermal haline deep |
Sequential, cmocean (vendored) |
balance |
Diverging, cmocean (vendored) |
batlow lipari hawaii oslo davos |
Sequential, Crameri (vendored) |
vik roma bam cork |
Diverging, Crameri (vendored) |
romaO |
Cyclic, Crameri (vendored) |
kx.cmaps() lists the ones that are available in the installed matplotlib as those implemented in matplotlib 3.10 or newer
are not vendored.
Released under the MIT License. See LICENSE.
Copyright © 2026 Vedran Hrabar
Vendored palettes and colourmaps keep their own licences; see kx/styles/palettes/LICENCES.md
and kx/styles/cmaps/LICENCES.md.