Collect metrics from every inference cluster - #470
dennis-upbound wants to merge 20 commits into
Conversation


|
Docs preview: https://modelplane-docs-pr-470.vercel.app (ready once the site's Content workflow finishes) |

5cfcadf to
0e711f4
Compare
dennis-upbound
changed the title
ad85067 to
7805fd1
Compare

| pathPrefix: _output/functions/compose-model-service | ||
| - source: Tarball | ||
| tarball: | ||
| name: compose-metric-mapping |

There was a problem hiding this comment.
need to add the repo and write access to our CI team
| pathPrefix: _output/functions/compose-metric-mapping | ||
| - source: Tarball | ||
| tarball: | ||
| name: compose-telemetry-destination |
There was a problem hiding this comment.
need to add the repo and write access to our CI team
| spec: | ||
| group: modelplane.ai | ||
| names: | ||
| categories: [crossplane, modelplane] |
There was a problem hiding this comment.
please set a groupId as category or add a new: https://github.com/modelplaneai/modelplane/blob/main/docs/data/apigroups.yaml#L8
There was a problem hiding this comment.
Added platform to both. They were the only two XRDs without a group category.
| spec: | ||
| group: modelplane.ai | ||
| names: | ||
| categories: [crossplane, modelplane] |
There was a problem hiding this comment.
please set a groupId as category or add a new: https://github.com/modelplaneai/modelplane/blob/main/docs/data/apigroups.yaml#L8
There was a problem hiding this comment.
Added platform to both. They were the only two XRDs without a group category.

| <!-- vale write-good.Passive = NO --> | ||
| {{< hint warning >}} | ||
| **Draft.** This page documents [the metrics design][design], which isn't built yet. It's | ||
| here to check the experience reads well before it's implemented, and it's excluded from the | ||
| site by `draft: true`. It replaces [Collecting engine metrics]({{< ref | ||
| "guides/collecting-engine-metrics.md" >}}) when the per-cluster Prometheus stack is | ||
| removed, and takes that page's URL with it. | ||
|
|
||
| [design]: https://github.com/modelplaneai/modelplane/pull/363 | ||
| {{< /hint >}} |
There was a problem hiding this comment.
Given this introduces new Modelplane APIs, I think it deserves documentation in the 'main' docs - I'm thinking a new 'Monitor the fleet' section (or something like that) under the Platform heading in the sidebar. Ideally we'd add those docs in this PR.
There was a problem hiding this comment.
Moved it to Platform as "Monitor the Fleet" and deleted the Prometheus-stack guide it replaces, in this PR. The two pages that linked there link here now.
| spec: | ||
| exporters: | ||
| otlphttp: | ||
| endpoint: https://otel.example.internal |
There was a problem hiding this comment.
Can you enable more than one exporter at once? Do we expect other types?
Would an API like this work?
apiVersion: modelplane.ai/v1alpha1
kind: TelemetryDestination
metadata:
  name: platform
spec:
  sinks:
  - name: otel
    protocol: OTLP                # OTLP | PrometheusRemoteWrite
    otlp:
      endpoint: https://otel.acme.example
      transport: HTTP             # HTTP | GRPC
    auth:
      scheme: Bearer              # None | Bearer | Basic
      bearer:
        secretRef:
          name: otel-token
          key: token
  - name: prometheus
    protocol: PrometheusRemoteWrite
    prometheusRemoteWrite:
      endpoint: https://prom.acme.example/api/v1/write
    auth:
      scheme: Basic
      basic:
        secretRef:
          name: prom-credentials
status:
  conditions:
  - type: Ready
    status: "False"
    reason: SecretNotFound
    message: "Sink otel: Secret modelplane-system/otel-token has no key token"
I would imagine potentially allowing multiple TDs like this but rolling them up to form the actual composed config.
The goals of this sketch:
- Use lists of named subobjects, e.g. to allow multiple sinks of the same type
- Associate sinks with their creds
- Use a required discriminator field to clearly discriminate the union
There was a problem hiding this comment.
Took the named list and the per-sink credentials. That second one was a real bug — secretRef was one Secret for the whole object, so two sinks had to share it and tell their keys apart by prefix. Each sink mounts under its own directory now.
Left the body pass-through. The exporter schema is upstream and versioned separately from us, so a closed protocol enum means a Modelplane release per exporter and dropping the tls/retry/sending_queue settings destinations actually need — tls alone is 16 keys, and insecure_skip_verify is what an internal endpoint wants. The OTel Operator hit this twice and passed through both times, most recently typing the pipeline wiring in v1beta1 and leaving exporters/extensions as preserve-unknown-fields.
No discriminator either: Prometheus Operator uses optional siblings validated in the controller, and KEP-1027 never shipped, so there's no APIUnions gate and it'd be hand-written CEL. Say the word if you want one anyway.
There was a problem hiding this comment.
Went further on this — took the middle. A sink now types what's Modelplane's and passes through what's OpenTelemetry's:
sinks:
- name: primary
  type: otlphttp
  endpoint: https://otel.example.internal
  secretRef:
    name: telemetry-credentials
  auth:
    bearerTokenKey: token
  config:            # anything else the exporter takes
    compression: gzip
endpoint is required and typed — every exporter has one and it was the setting most worth catching at the apiserver. auth composes the bearertokenauth extension and wires the reference, since the collector carries no credential on an exporter, only a reference to one; that was previously three hand-written stanzas. Both render after config, so a passed-through key can't redirect a sink or unpick its credential.
One scheme, not an enum of them, per the conventions note about anticipating a union with a single optional field — and bearer reads a file from the sink's own directory, which sidesteps the env-var collision two Secrets would otherwise have. Anything else still works the old way: define the extension under spec.extensions and name it from config.
Still not typing the exporter body. TLS is 16 keys, retry and queue another dozen, and prometheusremotewrite is mid-deprecation of its top-level HTTP settings as of v0.158.0 — typing that means versioning our API through theirs.
 negz
left a comment
negz
left a comment
negz
left a comment
There was a problem hiding this comment.
I know a lot of this feedback is more design shaped. Sorry it's coming in so late.
| Modelplane provides these as queries and Grafana dashboards rather than as precomputed | ||
| series. To precompute them, export to Prometheus and write recording rules there. |
There was a problem hiding this comment.
Do we actually provide Grafana dashboards?

There was a problem hiding this comment.
I assumed we would provide them as examples in documentation, we can have them in the repo of course but i dont expect us settinf up grafana ourselves.
There was a problem hiding this comment.
We don't — there's nothing in the repo. Dropped the claim.
| description: >- | ||
| OTTL statements, rendered into the collector's transform | ||
| processor beside Modelplane's own. Modelplane does not | ||
| interpret them: what you write here is the collector's own | ||
| configuration language, documented by OpenTelemetry, and it | ||
| is the same thing Modelplane writes for vLLM. | ||
|
|
||
| Statements select through their own where clauses, so | ||
| nothing declares which engine a deployment runs. |
There was a problem hiding this comment.
Not super actionable feedback, but I don't love that we leak OTTL here. It'd be nice to abstract it so we have the freedom to switch out to another metric collector if we wanted to in future.
OTOH the only way I can do that is something like this, which feels like it'd have the downfalls of Crossplane P&T:
apiVersion: modelplane.ai/v1alpha1
kind: MetricMapping
metadata:
  name: my-engine
spec:
  metrics:
  # Rename.
  - from: my_engine_queued_requests
    to: modelplane_requests_waiting

  # Rename and convert units. The target's unit is known, so the mapping
  # says what the source is measured in, not a factor.
  # Real cases: SGLang KV transfer in ms, DCGM energy in mJ, FB_USED in MiB,
  # thermal violation in ns.
  - from: my_engine_kv_transfer_ms
    fromUnit: Milliseconds
    to: modelplane_request_kv_transfer_seconds

  # Fold two metrics into one, told apart by a fixed label.
  # Real case: vLLM prompt and generation tokens become
  # modelplane_tokens_total{direction}.
  - from: my_engine_input_tokens_total
    to: modelplane_tokens_total
    labels:
    - name: direction
      value: input
  - from: my_engine_output_tokens_total
    to: modelplane_tokens_total
    labels:
    - name: direction
      value: output

  # Rename a label and map its values onto Modelplane's vocabulary.
  # Real case: each engine's finish vocabulary becomes one reason label.
  - from: my_engine_requests_finished_total
    to: modelplane_responses_total
    labels:
    - name: reason
      from: finish_reason
      values:
        eos: stop
        max_tokens: length
        cancelled: abort

  # Take a histogram's count as a counter.
  # Real case: the gateway's duration histogram becomes
  # modelplane_requests_total.
  - from: my_engine_request_duration_seconds
    part: Count
to: modelplane_requests_totalThere was a problem hiding this comment.
Did it. spec.metrics is from/to/fromUnit and the function compiles to OTTL. Left out labels and part from your sketch — both real, neither has a caller yet.
fromUnit caught a live bug while I was converting: DCGM reports FB_USED in MiB and we were renaming it to modelplane_gpu_memory_used_bytes with no conversion, so the series read a millionth of the memory in use. A field that asks the question catches that; a hand-written statement doesn't.
| passthrough: | ||
| type: boolean | ||
| default: false | ||
| description: >- | ||
| Send this component's own metric names onward as well as the | ||
| modelplane_* ones they become. | ||
|
|
||
| Off by default, because a series the statements did not | ||
| rename is one whose meaning Modelplane cannot vouch for | ||
| across engines, and it costs the same to carry as one that | ||
| was renamed. On, for reading an engine's raw names during a | ||
| migration or while debugging that engine. | ||
|
|
||
| A passed-through series is still merged across a | ||
| deployment's replicas, so it keeps the labels the engine | ||
| gave it and carries no pod identity. |
There was a problem hiding this comment.
There was a problem hiding this comment.
FWIW I missed the discussion on #363 but I would recommend not adding this at all until we have clear demand for it. iiuc Part of the motivation was around migrations to this new design, which we shouldn't be prioritizing right now at this early stage of the project.
There was a problem hiding this comment.
+1, lets make it a follow up that we pick up when needed
| collector: | ||
| type: string | ||
| default: Composed | ||
| enum: [Composed, External] | ||
| description: >- | ||
| Whether Modelplane runs the fleet collector. Composed (the | ||
| default) puts one on the control plane, and every inference | ||
| cluster exports to it. External composes none, for a | ||
| platform that already operates one: each inference cluster | ||
| then exports to the endpoint below directly. | ||
|
|
||
| External gives up the single egress point, one place to | ||
| change the destination, and the control plane's own series | ||
| reaching the fleet without a path of their own. Whoever | ||
| imposed the endpoint has usually provided them already. |
There was a problem hiding this comment.
Are we sure we need this? I'd rather leave it out and add it once there's clear demand for it.
There was a problem hiding this comment.
Gone. Nothing read it either — there's no fleet collector composed here, each cluster exports straight to the destination's sinks, so a platform already running one points those at its own endpoint. If we do compose one later, whether to is a composition-level choice rather than a field.
| # The GPUs, through whichever vendor's exporter the stack installed. DCGM | ||
| # reports energy in millijoules, which the unit in the name says it is not. | ||
| _GPU = { | ||
| "DCGM_FI_DEV_FB_USED": "modelplane_gpu_memory_used_bytes", | ||
| "DCGM_FI_PROF_GR_ENGINE_ACTIVE": "modelplane_gpu_compute_active_ratio", | ||
| "DCGM_FI_PROF_PIPE_TENSOR_ACTIVE": "modelplane_gpu_tensor_active_ratio", | ||
| "DCGM_FI_PROF_DRAM_ACTIVE": "modelplane_gpu_memory_bandwidth_ratio", | ||
| "DCGM_FI_DEV_GPU_TEMP": "modelplane_gpu_temperature_celsius", | ||
| "DCGM_FI_DEV_POWER_USAGE": "modelplane_gpu_power_watts", | ||
| } |
There was a problem hiding this comment.
Ideally I'd like the built-in MMs for vLLM and SGLang to actually show up in the API so you can see them like any other MM, and to avoid needing two separate codepaths. I can't think of any obvious place to compose them though.
The next best thing would be to specify all of this config as two hardcoded MetricMapping Pydantic objects and artificially prepend them to the mappings required resources. That way we exercise the same code whether the user is specifying MMs (which I imagine'll be pretty uncommon) or we're using our built-ins.
There was a problem hiding this comment.
Done — five of them, prepended to the required resources, so built-in and operator mappings go through the same code. They're the same shape now too, since the kind holds from/to rather than statements.
| # Pinned rather than floating: a collector that silently changed what it | ||
| # renames on a chart bump would move the metric surface under an operator's | ||
| # dashboards. | ||
| IMAGE = "otel/opentelemetry-collector-contrib:0.139.0" |
There was a problem hiding this comment.
This is a pretty old version right?
(Also might be worth asking an agent to review commentary in this PR for low value / filler content. This comment reads a bit filler-y.)
There was a problem hiding this comment.
Agree, we should start with a newer version plus probably add a renovate to update as OTEL stuff release quite often
There was a problem hiding this comment.
Bumped to 0.161.0. 0.162.0 is tagged but has no multi-arch manifest on Docker Hub yet. Did a pass over the commentary in this PR and cut three, that one included. No renovate rule yet — worth a follow-up.
| mounts.append({"name": "credentials", "mountPath": "/etc/modelplane/telemetry", "readOnly": True}) | ||
| env_from.append({"secretRef": {"name": secret_name}}) | ||
|
|
||
| return [ |
There was a problem hiding this comment.
Could/should any of this be Manifest entries in the array of common serving stack components?
I assume some of it (e.g. config computed at runtime) can't. The commentary should clarify why.
There was a problem hiding this comment.
Not really — the stack list is fixed at build time and every object here depends on request-time data: the ConfigMap is compiled from the destination and the mappings, and the Deployment carries that config's digest plus the per-sink secret mounts. The ServiceAccount and RBAC would fit, but splitting one component across two mechanisms would put a collector's permissions on clusters running no collector. Put that in the docstring.
ac8673f to
2c8b399
Compare
4a7f44d to
494313c
Compare

Modelplane collects from everything it installs and normalizes it onto
one modelplane_* surface, and two things about that are the operator's:
where the telemetry goes, and what to do about a component Modelplane
ships no rules for. These are the two kinds the telemetry design gives
them.

Both hold OpenTelemetry collector configuration that Modelplane passes
through unread. A MetricMapping carries OTTL statements rendered into
every inference cluster's transform processor, and passthrough for
keeping a component's own metric names flowing during a migration. A
TelemetryDestination carries the collector's exporters and extensions,
a secretRef so credentials stay out of the object, and collector:
External for a platform that already runs a fleet collector and hands
over its endpoint.

Passing configuration through unread is the point rather than an
omission. An operator writes the collector's own language, documented
upstream, so any exporter or authenticator it gains works without a
Modelplane release, and a field-by-field schema would either restate all
of it or quietly cap what a destination can be.

Signed-off-by: Dennis Ramdass <dennis@upbound.io>
Neither kind composes anything: compose-serving-stack is what renders
them into a collector. So both functions could mark their XR Ready and
look no further, which for a data resource is nearly honest. It is also
how a fleet ends up producing no telemetry with every object green.

A MetricMapping reaches every inference cluster, so the function
resolves them and reports the count, and is not Ready when there are
none. It also catches a mapping carrying neither statements nor
passthrough, which changes nothing and otherwise looks exactly like one
that works.

A TelemetryDestination gets the one check Modelplane can make without
modelling what an exporter is. An exporter's auth block names an
authenticator by extension name, and the collector refuses to start when
no extension defines it, so a typo there stops telemetry with the
failure two layers from its cause. The same for a credential Secret that
does not exist, and for a destination carrying no exporters at all.

Neither reads further in. Validating the statements or the exporters
would be Modelplane modelling the collector's configuration, which is
what these kinds exist to avoid.

Signed-off-by: Dennis Ramdass <dennis@upbound.io>
x-kubernetes-preserve-unknown-fields generates as dict[str, Any], which
is what a block passed through unread should be, and the collector enum
generates as a Literal with its default.

Signed-off-by: Dennis Ramdass <dennis@upbound.io>
What an operator reads: the metric surface, where to point a
TelemetryDestination, what to write for an engine Modelplane ships no
statements for, and migrating off the per-cluster Prometheus, with the
rename table and the compatibility rules that keep an existing dashboard
working while its panels are rewritten.

draft: true until the kinds it describes are composing and collecting,
so it stays out of the published site. The Vale vocabulary comes with
it; every word it adds is one only this guide uses.

Signed-off-by: Dennis Ramdass <dennis@upbound.io>

The MetricMapping and TelemetryDestination kinds accept OTTL statements and
exporter config, but nothing renders a collector from them, so a fleet that
declares both still has no telemetry pipeline.

Compose one collector per InferenceCluster from those kinds: a ConfigMap
carrying the rendered YAML, a Deployment running it, and the RBAC the
Prometheus receiver needs to discover pods. The receiver scrapes engines, the
gateway and the substrate; the transform processor applies the built-in rename
statements plus whatever the MetricMappings add, and the exporters come
straight from the TelemetryDestination.

The Deployment carries a checksum of the rendered config so a mapping or
destination change restarts the collector. The checksum is a sha256 of the
config rather than Python's hash(), which is seeded per process and would
redeploy on every reconcile.

Co-Authored-By: Claude Opus 5 <noreply@anthropic.com>
Signed-off-by: Dennis Ramdass <dennis@upbound.io>
Two fields went in ahead of any demand for them.

TelemetryDestination's collector enum chose between composing a fleet
collector and deferring to someone else's. Nothing composes a fleet collector
yet, and nothing reads the field: each inference cluster's collector exports
straight to the destination's exporters, so a platform that already runs one
points those exporters at its own endpoint and the enum never comes up. When a
fleet collector does land, whether to compose it is a composition-level
choice, not a field every user reads.

MetricMapping's passthrough kept an engine's own metric names flowing during a
migration off the Prometheus stack. Migrations aren't what this project should
be optimising for yet, and the flag was a bool where an enum would belong if
it came back. Dropping it means only modelplane_* leaves a cluster, which
takes a branch out of the collector config too.

Three smaller corrections alongside: the collector image was pinned 23
releases back, at 0.139.0; both XRDs were missing the category that files them
under Platform in the API reference; and the guide offered Grafana dashboards
that don't exist anywhere in this repo.

Co-Authored-By: Claude Opus 5 <noreply@anthropic.com>
Signed-off-by: Dennis Ramdass <dennis@upbound.io>
The collector refuses to start on the config this composes. The statement that
scales DCGM's energy counter reads value_double, which is a datapoint path,
and every statement was rendered into a single metric-context block:

  segment "value_double" from path "metric.value_double" is not a valid path
  nor a valid OTTL keyword for the metric context

Render two blocks instead, the datapoint one first. It has to be a separate
block rather than an earlier line in the same one: the transform processor
finishes a block over every datapoint before it starts the next, so a rename
sharing the block would run after the first datapoint was scaled and leave
every later datapoint unmatched, and unscaled.

Verified by running `validate` in the collector image itself, against the
rendered config, with and without exporter authentication.

Also build the renames Modelplane provides as MetricMappings rather than as a
bare list of statements, so they reach the collector through the same path an
operator's mapping does.

Co-Authored-By: Claude Opus 5 <noreply@anthropic.com>
Signed-off-by: Dennis Ramdass <dennis@upbound.io>
DCGM reports DCGM_FI_DEV_FB_USED in MiB. It is renamed to
modelplane_gpu_memory_used_bytes, with no conversion, so the series reads
about a millionth of the memory actually in use.

Scale it in the datapoint block beside the energy counter, which had the same
problem in millijoules and was already handled there.

Co-Authored-By: Claude Opus 5 <noreply@anthropic.com>
Signed-off-by: Dennis Ramdass <dennis@upbound.io>
A MetricMapping held OTTL statements, which put the collector's own
configuration language in a Modelplane API. It leaves nothing to validate at
the apiserver, pins what an operator writes to one collector's grammar, and
commits Modelplane to OTTL for as long as the kind lives.

Take the metrics themselves instead: `from` is what the component emits, `to`
is what Modelplane calls it, and `fromUnit` says what the source is measured
in when the target name claims something else. compose-serving-stack compiles
them to OTTL, which is where knowing the collector belongs.

The unit field is not speculative. DCGM reports framebuffer memory in MiB and
energy in millijoules, and both are renamed onto names claiming bytes and
joules; we had the energy conversion and were missing the memory one. A field
that asks the question catches that where a hand-written statement doesn't.
Every rename Modelplane provides is expressible here, so the built-ins and an
operator's mapping are now the same shape as well as the same code path.

Left out: folding two metrics into one under a label, and taking a histogram's
count as a counter. Both are real, neither has a caller yet.

TelemetryDestination grows the same treatment on its own terms. The exporters
map becomes a list of named sinks, each with the exporter `type` to send with
and that exporter's `config` passed through unread, because the exporter
schema is upstream and versioned separately - typing it would mean a
Modelplane release per exporter, and dropping TLS, retry and queue settings
that destinations actually need. What does become typed is the part that was
broken: `secretRef` moves onto the sink, so two sinks no longer share one
Secret and tell their keys apart by prefix, and each mounts under its own
directory.

Both kinds are APIs a platform engineer uses, so the guide moves out of
guides/ and into the Platform section as "Monitor the Fleet", and the
Prometheus-stack page it replaces is deleted rather than left to contradict
it. The two pages that linked there now link here.

Verified by running `validate` in the collector image against the compiled
config, with two sinks, per-sink credentials, and an operator mapping carrying
a unit conversion.

Co-Authored-By: Claude Opus 5 <noreply@anthropic.com>
Signed-off-by: Dennis Ramdass <dennis@upbound.io>
`from` was interpolated into an OTTL comparison with nothing constraining it,
so a quote closed the string early and the rest of the value became part of
the query:

  set(name, "modelplane_pwned") where name == "x" or true or name == "y"

That renames every series the collector sees. A typo does it as readily as
anything deliberate, and the result is a fleet whose metrics all arrive under
one wrong name. Hold the field to the characters a Prometheus or OpenTelemetry
metric name can contain, which every built-in already satisfies.

Two other things found reading it back:

Which TelemetryDestination wins when several exist came from the API server's
list order. The collector restarts on a change to its rendered config, so an
unstable choice would redeploy it on alternate reconciles. Sort by name.

The guide offered four metrics nothing composes - the saturation maximum, the
token counters, and the two that need per-replica GPU state - and mapped three
more in its migration table. A rename carries one metric to one name, so the
counters that fold several series under a label aren't part of this surface
yet; say that instead of promising them, and point at the histograms that do
exist.

Co-Authored-By: Claude Opus 5 <noreply@anthropic.com>
Signed-off-by: Dennis Ramdass <dennis@upbound.io>
The lock records one content hash over apis/, so rebasing onto a main that
changed apis/ leaves it describing neither tree.

Co-Authored-By: Claude Opus 5 <noreply@anthropic.com>
Signed-off-by: Dennis Ramdass <dennis@upbound.io>
494313c to
03d91f4
Compare
A sink was a name, an exporter type, and a block of configuration passed
through whole. That left the endpoint - the one setting every exporter has and
every sink needs - as an unvalidated key inside the blob, and it made
authentication something an operator had to assemble by hand: the collector
carries no credential on an exporter, only a reference to an extension, so
bearer auth meant writing the extension, naming it, and referencing it from
the sink.

Lift the two out. `endpoint` is required and typed. `auth.bearerTokenKey`
names the key in the sink's Secret, and Modelplane composes the
bearertokenauth extension and wires the reference. Both are rendered after the
operator's config, so a passed-through key can't quietly redirect a sink or
unpick its credential.

The rest stays pass-through, because the rest is OpenTelemetry's: TLS is
sixteen keys, the retry and queue blocks a dozen more, and the schema moves on
its own schedule - the Prometheus remote-write exporter is deprecating its
top-level HTTP settings in this release series. Typing that would mean a
Modelplane release per setting, and telling anyone who needs one we have never
heard of to wait for it.

A scheme Modelplane doesn't compose is unaffected: define the extension under
spec.extensions and name it from the sink's config, which is what the auth
block does on your behalf. The function counts both as defining an
authenticator, so a sink using either is still checked against the failure
that makes a collector refuse to start.

Verified against `validate` in the collector image: the composed extension,
its reference, and a sink carrying compression and queue settings alongside.

Co-Authored-By: Claude Opus 5 <noreply@anthropic.com>
Signed-off-by: Dennis Ramdass <dennis@upbound.io>
`endpoint` was required, on the assumption every exporter has one. Several
don't: Kafka takes `brokers`, the file exporter a `path`, and the debug
exporter nothing at all. The field's own neighbour advertises Kafka as a
supported type, so the schema contradicted itself and made three exporters
unreachable - including the one you would reach for first when nothing is
arriving.

Make it optional. It stays typed, because it is still the setting every
destination that has one has to get right, and it is still rendered after the
passed-through config so it cannot be overridden from there.

Co-Authored-By: Claude Opus 5 <noreply@anthropic.com>
Signed-off-by: Dennis Ramdass <dennis@upbound.io>
Running this on a cluster showed the collector starting cleanly and collecting
almost nothing.

The gateway job asked Envoy for /metrics and got a 404 every interval. Envoy
publishes Prometheus on its admin port and annotates the pod with the path, so
take the path from the annotation. This is the whole modelplane_frontend_*
group - the series an SLO is written against.

The substrate job honoured prometheus.io/scrape and then ignored
prometheus.io/port, so it scraped whichever port a pod declared first: the
cert-manager webhook declares 10250 and annotates 9402, and the collector
logged a 400 against its TLS port every interval. Honour the rest of the same
convention.

With the port honoured the gateways match the substrate job too, since they
annotate themselves, so drop from it the pods the other two jobs already name.
Three jobs over disjoint sets.

Also emit OTTL paths with their context. The collector accepts bare ones,
rewrites them, and logs every statement it rewrote asking the author to stop.
Modelplane is the author, so this is a change nobody's stored MetricMapping
has to make.

Co-Authored-By: Claude Opus 5 <noreply@anthropic.com>
Signed-off-by: Dennis Ramdass <dennis@upbound.io>
The collector reads a pod's labels during discovery to attribute the metrics it
scrapes, and it read four that nothing sets. Engine metrics were never
collected at all: the job matched modelplane.ai/serving against the literal
"true", where that label carries the replica's name, so it selected nothing.
Relaxing the match alone would have been worse - every series would have
arrived with an empty deployment, engine and role, and the merge across
replicas would have collapsed every engine on the cluster into one.

Stamp the identity where the pod template is built, so a backend can't compose
a serving pod without it. Deployment comes off the replica, which the composite
already labels; engine and role off the engine and member. Workers carry it
too: a worker holds GPUs, and the GPU series are the deployment's. Match on the
deployment label's presence rather than its value.

No model label. A ModelReplica doesn't know which ModelService fronts it, and a
model name carries a slash, which a label value can't. Deployment is finer
grained anyway - a deployment serves one model, a model may have several - so
it replaces model in the merge keys and in the guide.

Verified on the local two-cluster e2e: a pod carrying these labels is
discovered, its vllm: and DCGM_ series arrive renamed, and each carries
cluster, namespace, deployment, engine and role. DCGM_FI_DEV_FB_USED at 1024
MiB arrives as modelplane_gpu_memory_used_bytes at 1073741824.

Co-Authored-By: Claude Opus 5 <noreply@anthropic.com>
Signed-off-by: Dennis Ramdass <dennis@upbound.io>
Every series the collector exports carries a cluster attribute, and it carried
the ServingStack's own name - generated, suffixed with a hash, and matching
nothing anyone would query for. Take the composite label Crossplane stamps,
which is the InferenceCluster's name.

Found by reading the exported series on a live cluster: they arrived labelled
local-serving-stack-d4206 rather than local.

While there: the engines job selects the pods to scrape by the deployment
label, and the substrate job dropped them by the serving label. Workers carry
the first and not the second, so a worker that annotated itself for scraping
would have been collected by both jobs under two names. Both partition on the
same label now.

Co-Authored-By: Claude Opus 5 <noreply@anthropic.com>
Signed-off-by: Dennis Ramdass <dennis@upbound.io>
Six bugs in the metrics path reached a green CI: the engine scrape job matched
a label value that never existed, the gateway job asked Envoy for a path it
404s on, the substrate job ignored the port annotation beside the one it read,
a value rewrite ran in a context that cannot reach values, framebuffer memory
was renamed to bytes while holding MiB, and every series was labelled with a
generated name rather than the cluster's. Unit tests, crossplane render and the
collector's own config validation all passed throughout, because none of them
scrapes anything.

Assert it where something does. The destination goes in with the other
manifests, so the collector composes while the model rolls out and --verify
waits for nothing extra. Its debug sink prints what reached it to its own log,
so the assertion is a log read and no metrics backend has to exist. The mock
engine serves two real names, one of which needs a unit conversion, and
--verify checks they arrive renamed, converted, carrying the identity off the
pod, and that the engine's own names did not leave the cluster.

Co-Authored-By: Claude Opus 5 <noreply@anthropic.com>
Signed-off-by: Dennis Ramdass <dennis@upbound.io>
Every modelplane_gpu_* series and the energy counter were empty on GKE. The
substrate job finds a component by its prometheus.io/scrape annotation, and
nothing annotates DCGM: GKE runs a managed exporter in gke-managed-system that
carries only GKE's own component labels, and the NVIDIA GPU operator installs
none at all there. Modelplane doesn't install one either - it reads whatever
the cluster provides - so nothing was reading it.

Give it a job of its own, keyed on the exporter's name rather than an
annotation it doesn't carry. The two packagings spell it differently,
gke-managed-dcgm-exporter and dcgm-exporter, and put it on different labels
depending on who packaged it, so both labels are read and the match is on the
name they share.

Verified against a real L4 on GKE: all seven series arrive renamed, carrying
the node and the card's UUID, and the conversions hold on real values - 7060 J
from DCGM's millijoules, 16.89 W, 42 C.

Co-Authored-By: Claude Opus 5 <noreply@anthropic.com>
Signed-off-by: Dennis Ramdass <dennis@upbound.io>
A Prometheus backend received every series stripped of everything that says
what it measures: no cluster, no deployment, no engine, no role. Only job and
instance survived.

Modelplane's identity is held as resource attributes, because that is what the
merge across replicas groups on, and the Prometheus remote-write exporter drops
resource attributes unless asked not to. The debug exporter prints them, so
every check up to this point showed them arriving. It took a Grafana panel
legend rendering as "/" to notice that the one backend most people use sees
none of it.

Turn the conversion on for the exporters that flatten, under an operator's own
config rather than over it, so a sink that sets it wins.

Also share the DCGM selector between the job that keeps those pods and the job
that has to leave them alone. A GPU operator's exporter usually does annotate
itself for scraping, so the two drifting apart would collect it twice under two
job names - which is the bug the gateway and engine drops already exist to
prevent. A test now holds every such pair together.

Co-Authored-By: Claude Opus 5 <noreply@anthropic.com>
Signed-off-by: Dennis Ramdass <dennis@upbound.io>

|
The fleet's telemetry in Grafana, from the GKE cluster above: a real L4 serving Qwen2.5-0.5B, exported by the composed collector through a
GPU memory reads 20.7 GiB because the value is bytes — DCGM reports MiB and the name claims bytes, which is what Taking this caught the last bug. Every legend rendered as (The doubled stats are pre- and post-fix series in the same window.) |
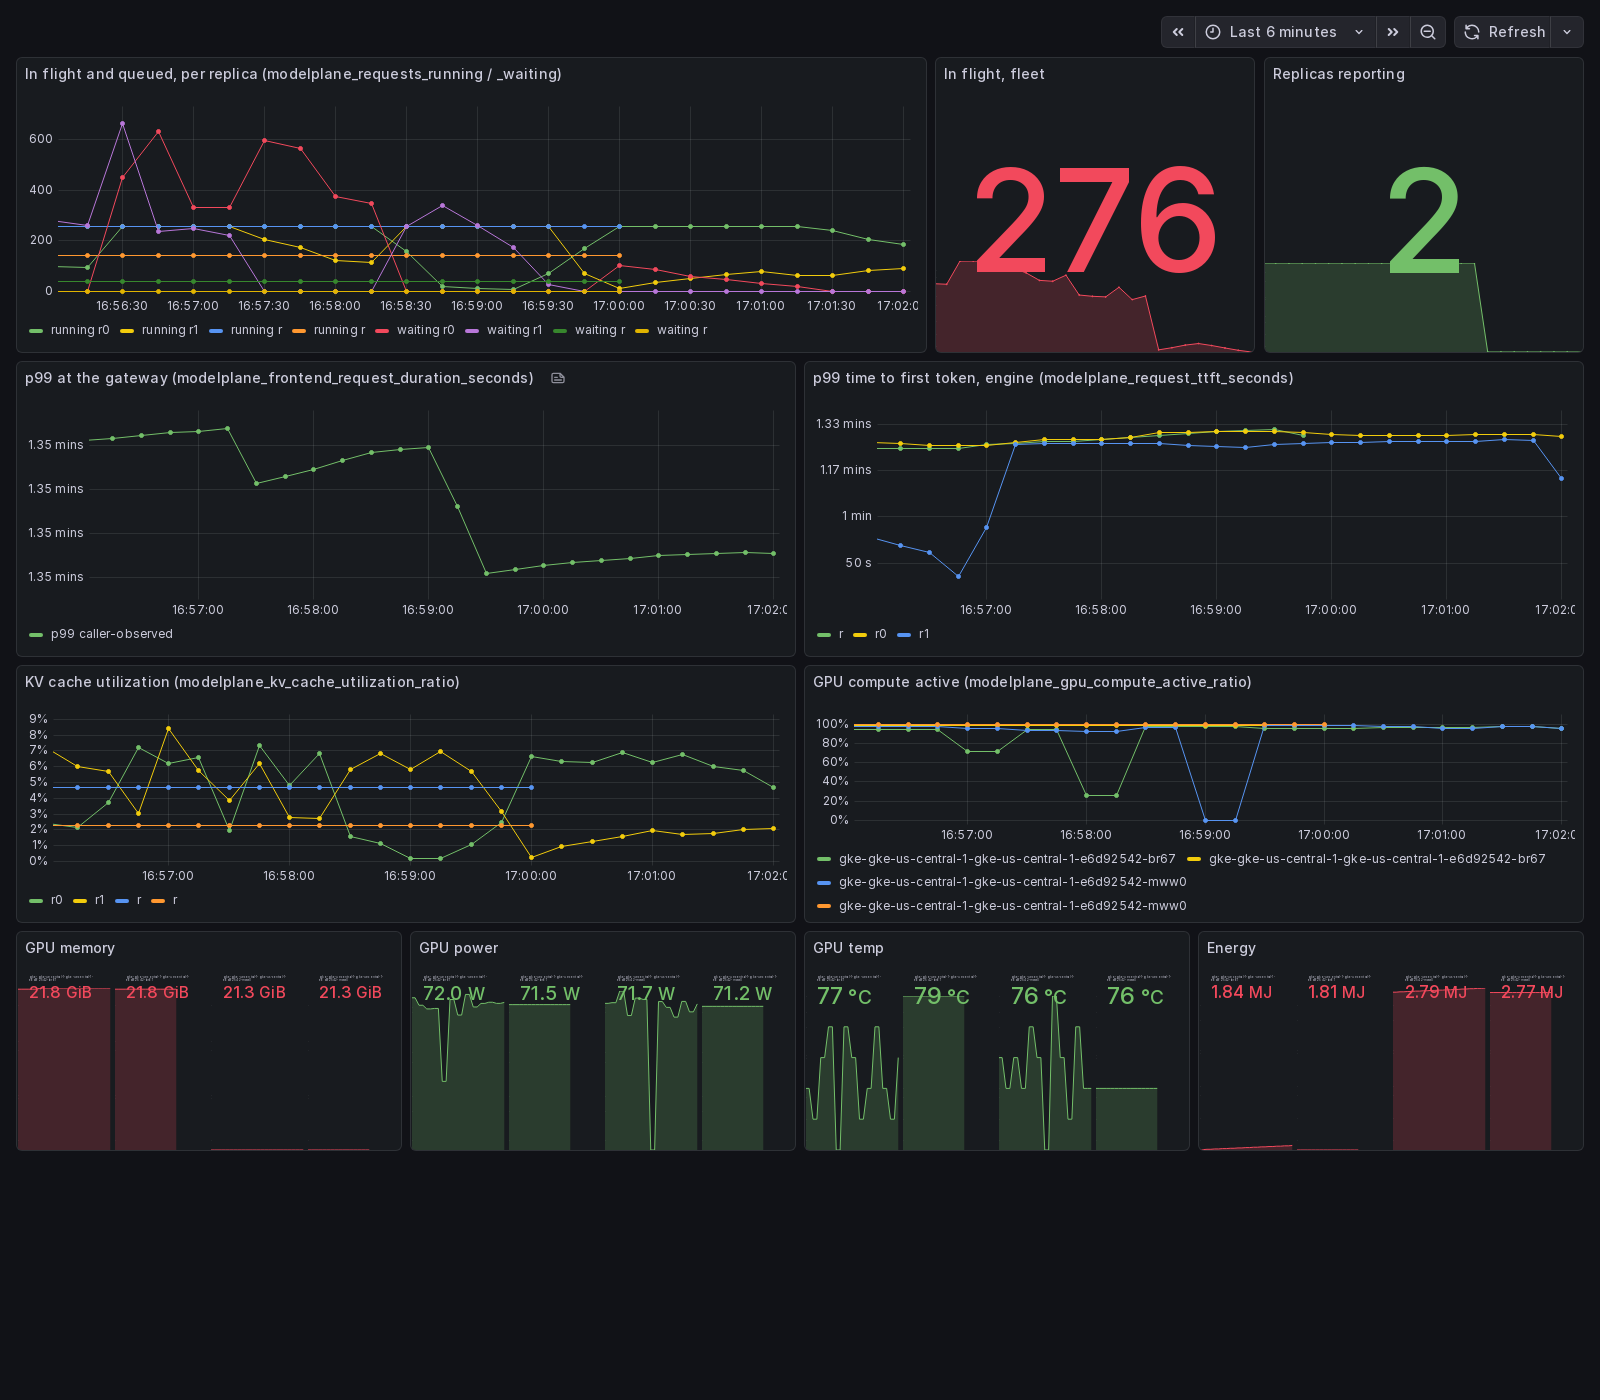
Service discovery attaches the pod's name, uid and replicaset to every scrape,
and the scrape its address, and all of it lands on the resource. Keeping it
does two kinds of damage.

The merge across replicas groups on the resource, so a pod name there holds
every replica in a resource of its own and nothing merges. And an exporter that
flattens resources into labels then publishes a pod label - the one the design
rules out by name, because a rolling update mints a fresh one on every deploy
and a billing backend counts it active for half an hour after it dies.

Keep an allowlist instead, ahead of the merge: the cluster, namespace,
deployment, engine and role a series belongs to, plus the node for the GPU
series, which belong to hardware rather than to a deployment. An allowlist
rather than a list of what to drop, because what discovery attaches grows.

Verified on GKE with two replicas on two nodes: one series, carrying those
attributes and nothing else, where before there was one per pod carrying
k8s_pod_name, k8s_pod_uid, k8s_replicaset_name and the pod's address.

Co-Authored-By: Claude Opus 5 <noreply@anthropic.com>
Signed-off-by: Dennis Ramdass <dennis@upbound.io>
This branch has not been deployed
4 participants


Description of your changes
Implements the metrics half of
design/telemetry.md, merged in #363. Today a fleet has no way to get engine, gateway or GPU metrics off its clusters, and the names it would get differ per engine anyway.Two kinds and a collector.
MetricMappingnames the metrics one component emits and what Modelplane calls them —from,to, andfromUnitwhere the source is measured in something other than what the target name claims.TelemetryDestinationnames the sinks the fleet's metrics go to: each carries the exportertypeto send with, that exporter's ownconfig, and its ownsecretRef.compose-serving-stackrenders a collector perInferenceCluster: a ConfigMap of the rendered YAML, a Deployment running it, and the RBAC the Prometheus receiver needs for pod discovery. It scrapes engines, the gateway and the substrate, and relabels Modelplane's identity off the pod labels, so a mapping never has to carry labels of its own. Modelplane provides five built-in mappings covering vLLM, SGLang, the gateway, the picker and DCGM; an operator's mapping runs after them, through the same code. The Deployment carries a sha256 of the rendered config, so editing a mapping or a destination restarts the collector and an unchanged one doesn't.Mappings compile to OTTL here rather than being written as OTTL in the API. Knowing the collector's configuration language is this function's job, not an operator's: the typed fields validate at the apiserver, they don't pin what an operator wrote to one collector's grammar, and they leave room to render something other than OTTL later.
fromUnitearns its place immediately — DCGM reports framebuffer memory in MiB and energy in millijoules, both renamed onto names claiming bytes and joules, and a field that asks the question catches the one we'd got wrong.A sink types what belongs to Modelplane and passes through what belongs to OpenTelemetry.
name,type,endpoint,secretRefandauthare fields. Everything else the exporter takes — TLS, retry, queueing, compression — goes underconfigunread.auth.bearerTokenKeynames the key in the sink's Secret and Modelplane composes thebearertokenauthextension and wires the reference, because the collector carries no credential on an exporter, only a reference to an extension. A scheme Modelplane doesn't compose still works: define the extension underspec.extensionsand name it from the sink'sconfig.The rest stays pass-through because the schema is upstream and moves on its own schedule — TLS alone is 16 keys, and the Prometheus remote-write exporter is deprecating its top-level HTTP settings in this release series. Typing it would mean a Modelplane release per setting. The OpenTelemetry Operator made the same call twice, most recently when it typed its pipeline wiring in v1beta1 and left
exportersandextensionsas preserve-unknown-fields.The collector is rendered as a Deployment rather than an
OpenTelemetryCollector. That CRD would put the OpenTelemetry Operator on every GPU cluster to own and upgrade, for a Deployment and a ConfigMap, and the receiver does its own service discovery so there's no target allocator to want either.The mapping and destination functions compose nothing themselves, so both could mark Ready and stop. They don't, because Ready meaning nothing was checked is how a fleet produces no telemetry with every object green. A
MetricMappingreports how many clusters took its renames and isn't Ready at zero. ATelemetryDestinationcatches a sink naming an authenticator no extension defines — the collector refuses to start on that, so otherwise the failure surfaces two layers from its cause.Docs go under Platform as Monitor the Fleet, replacing the Prometheus-stack guide, which is deleted.
Scope
The design describes a surface of 50 metrics. This composes the 23 reachable by renaming one metric to one name and converting its unit: the engine, GPU and gateway-latency core. #476 enumerates the other 27 grouped by what blocks each — 11 need per-object state from resource-state-metrics, 8 need
MetricMappingto grow the label-folding and histogram-count forms, 2 need the collector to merge replicas twice, and 6 need instrumentation that doesn't emit yet. The guide describes what this composes, not the whole design.Verification
Six bugs in this path reached a green CI before any of this was run: unit tests,
crossplane renderand the collector's own config validation all pass withoutscraping anything. So each layer below was run against something that does.
The collector's own validator
otelcol validateinsideotel/opentelemetry-collector-contrib:0.161.0, against theconfig this composes. Three sink topologies: one sink no auth, two sinks with per-sink
credentials, and two sinks of one type. All exit 0.
Caught: a value rewrite rendered into the metric context, where
value_doubleis not avalid path and the collector refuses to start.
Local, two clusters, no cloud or GPU (
nix run .#e2e -- --verify)Now asserted in CI. The mock engine serves
/metricswith two real names, and--verifychecks they arrive renamed, converted, and attributed:
vllm:num_requests_waitingmodelplane_requests_waitingDCGM_FI_DEV_FB_USEDat 1024 MiBmodelplane_gpu_memory_used_bytesat 1073741824cluster,namespace,deployment,engine,rolevllm:names downstreamCaught: the engine scrape job matched a label value that never existed, so engine metrics
were never collected at all; the engine's container port was unnamed, so the job would have
matched nothing even once the label was fixed; the gateway job asked Envoy for
/metricsand got a 404 every interval; the substrate job ignored
prometheus.io/portbeside theannotation it read, and scraped cert-manager's TLS webhook; and every series was labelled
with the ServingStack's generated name rather than the cluster's.
Real GKE, real L4
A
source: GKEInferenceClusterprovisioned into a live project: VPC, subnet, serviceaccount and key,
ProjectIAMMember, the cluster, and both node pools (g2-standard-8GPU,e2-standard-4system).READY=True, serving stack installed, collector1/1 Running,zero restarts, zero scrape failures, zero deprecation warnings.
The seven GPU series arrive from the card, carrying the node and its UUID, and the
conversions hold on live values:
modelplane_energy_joules_totalmodelplane_gpu_power_wattsmodelplane_gpu_temperature_celsiusmodelplane_gpu_memory_used_bytesCaught: every
modelplane_gpu_*series and the energy counter were empty on GKE. Nothingannotates DCGM for scraping — GKE runs a managed exporter carrying only its own component
labels, the NVIDIA GPU operator installs none there, and Modelplane installs none either.
Real vLLM on that cluster
vllm/vllm-openai:v0.23.0serving Qwen2.5-0.5B-Instruct on the L4, with traffic through it.Twenty series arrive renamed — thirteen from the engine, seven from the card — each carrying
cluster=gke-us-central,deployment=qwen-demo,engine=qwen,role=Standalone.modelplane_gpu_memory_used_bytesreads 22215131136, which is 21186 MiB × 1048576: vLLMholding ~92% of the L4's 23034 MiB, its default
gpu_memory_utilization. The conversion isexact on a real loaded model rather than a synthetic value.
A Grafana dashboard over that Prometheus
A
prometheusremotewritesink into the cluster's own Prometheus, with panels overmodelplane_requests_waiting,modelplane_kv_cache_utilization_ratio, the four GPU statsand a p99 over
modelplane_request_ttft_seconds_bucket. 34 series arrive, grouped bydeploymentandengine.Caught: a Prometheus backend received every series stripped of its identity — no
cluster,deployment,engineorrole, onlyjobandinstance. The identity is held asresource attributes, which the remote-write exporter drops unless told otherwise, and the
debug exporter prints resource attributes, so every check before this one showed them
arriving. A panel legend rendering as
/is what exposed it.I have:
nix run .#buildand thepython,ty-*,test-*anddocs-valechecks.git commit -s.🤖 Generated with Claude Code