Network engineer with a passion for diagrams. I build tools with an ethos of simplicity and usability - each does one thing well, runs on hardware you already have, and makes no calls home.
All public domain, yours to fork or reuse without asking. Only the open-source packages each tool builds on keep their own licenses.
Windows desktop tools. Nothing installs, nothing needs admin, nothing phones home.
 |
 |
 |
 |
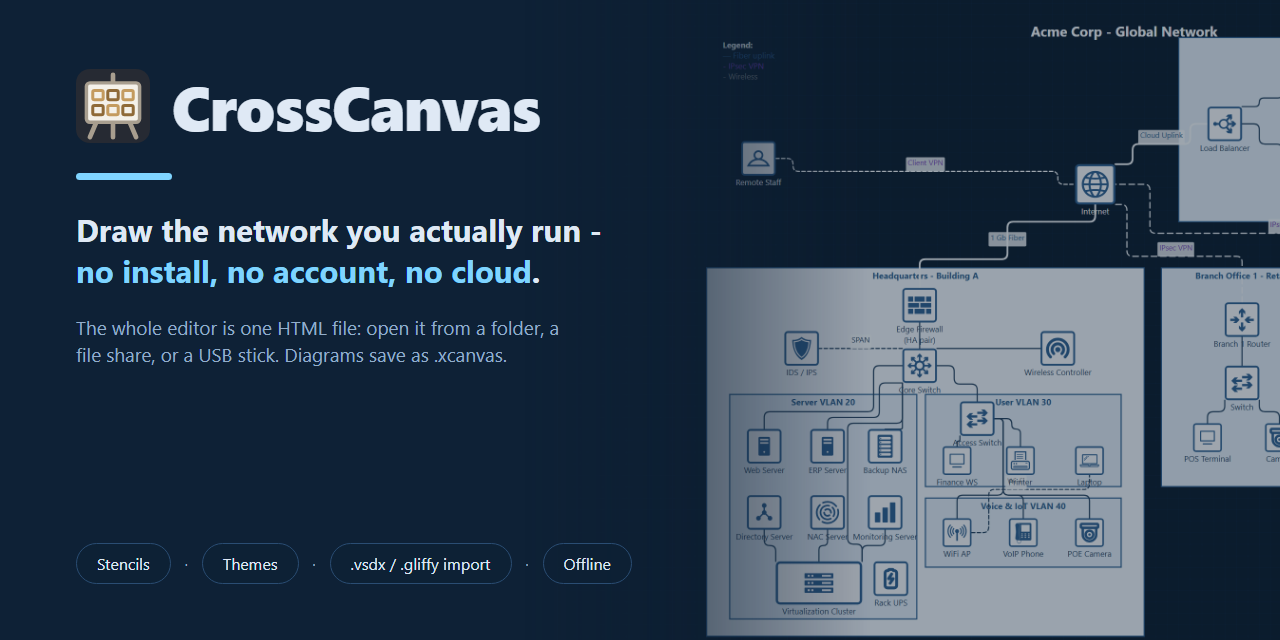
CrossCanvas - the diagram editor. One HTML file, no build step, no network calls. Imports Visio, draw.io and Gliffy. Try it
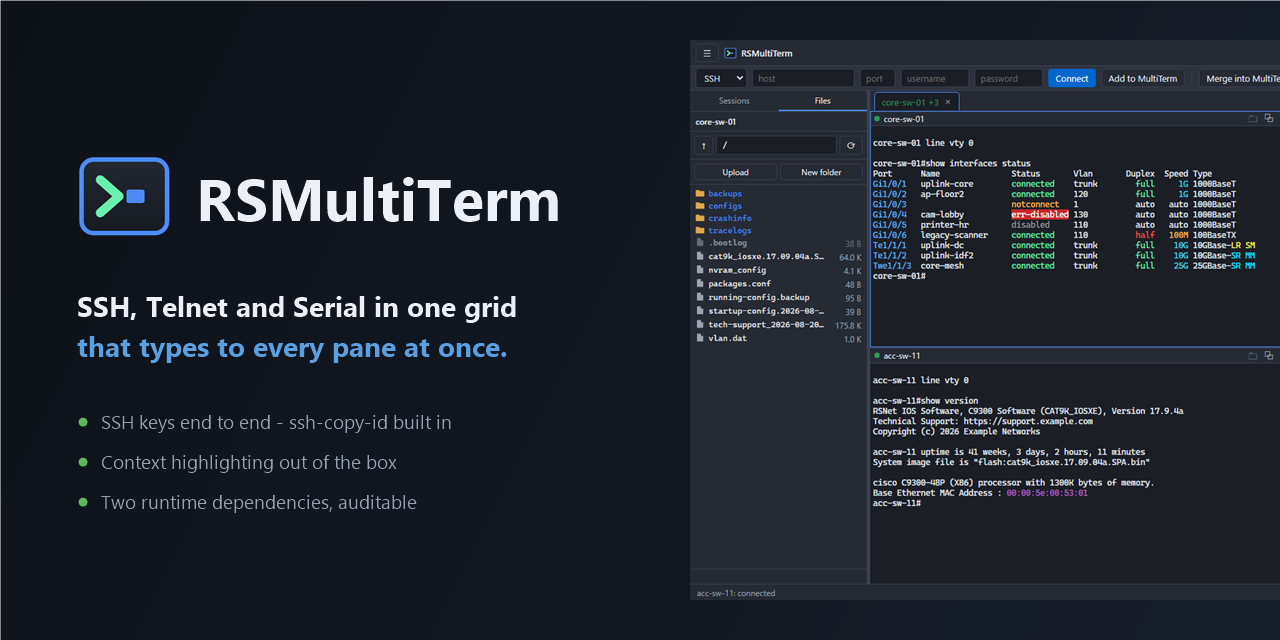
RSMultiTerm - the terminal emulator. SSH, Telnet and serial in one grid, typing to every pane at once. Logs every session.
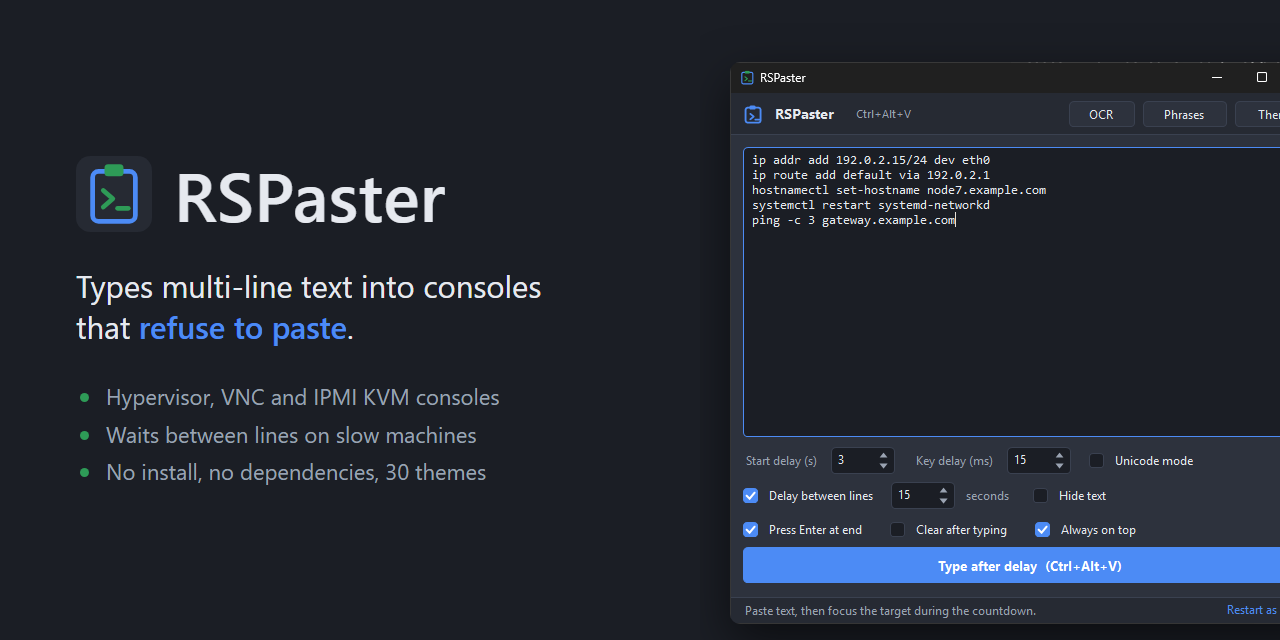
RSPaster - the pasting utility. Types into consoles that refuse to paste, and lifts text off the screen with OCR.
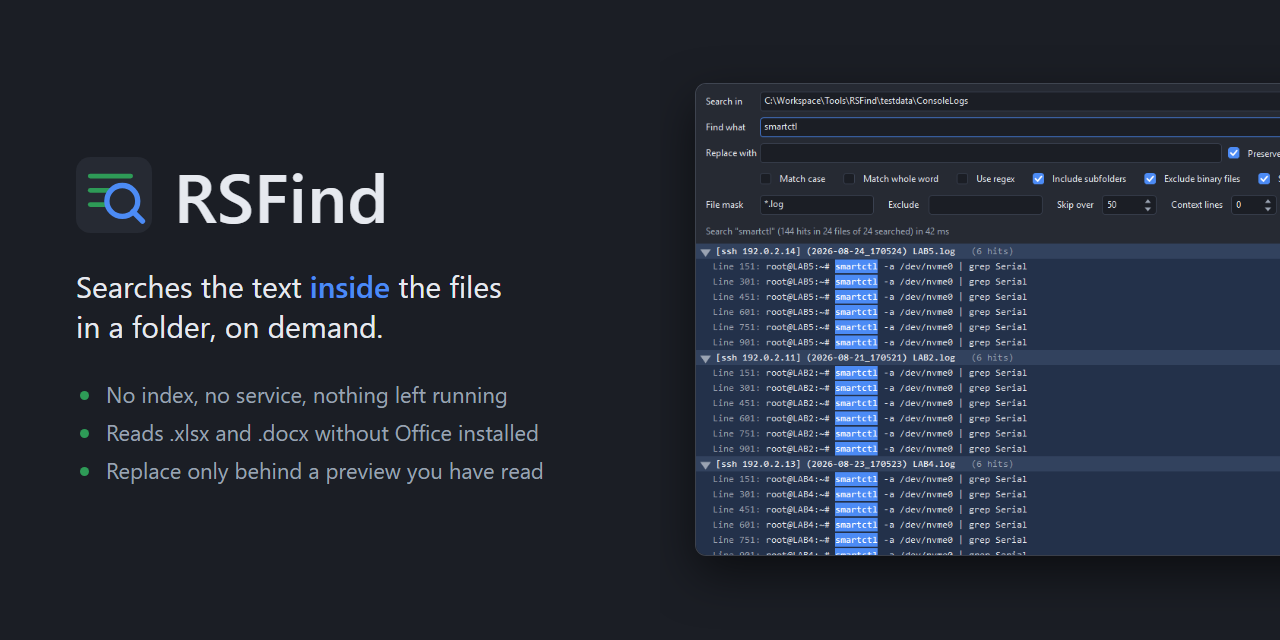
RSFind - the search tool. Find and replace across files, inside Office documents too, with undo on every run.
RSCanvas - the monitoring platform. A robust, unified successor to Canvas-Suite, albeit still in alpha. SNMP polling, reachability, syslog and traps, alerting, and wall boards driven by your own network diagram, all in one self-hosted process.
Canvas-Suite - the monitoring suite. Six apps that turn a network diagram into a live view of the network behind it. One-shot install scripts stand the whole thing up on a fresh Linux box or a Pi. Try it
 CrossCanvas draw the board |
 PingCanvas watch it live |
 SNMPCanvas measure it |
 SyslogCanvas catch what it says |
 AlertCanvas get paged |
 LaunchCanvas one front door |
RSConclave - the local LLM chat app. Send one prompt to several models and have another consolidate the answers, or seat two at a roundtable and let them argue it out. Nothing leaves the network. Try it
RSWreckGarage - a save editor for Wreckfest. Not a network tool, and the only one here I built purely for fun.