Repository navigation
Add Derivative on Error Option? #11
Description

After looking through Derivative Kick topic in the excellent blog by Brett Beauregard, I was wondering how much difference can be seen when comparing the input plots for derivative on error with the default derivative on measurement method.
For the test, I'll use the UNO I have setup with pin 3 PWM output → RC filter (100µF/10K) → input A0. Running AutoTune gives the following results for tuning parameters:
Stabilizing → AutoTune → t0 → t1 → t2 → t3 → done.
This process is easy to control.
Tu: 0.23 td: 0.01 Ku: 5.73 Kp: 3.44 Ki: 4.34 Kd: 0.10
Plot results using ZIEGLER_NICHOLS_PID tuning rule:
| Derivative on Measurement: dTerm = kd * dInput; | Derivative on Error: dTerm = -(kd * error); |
|---|---|
 |
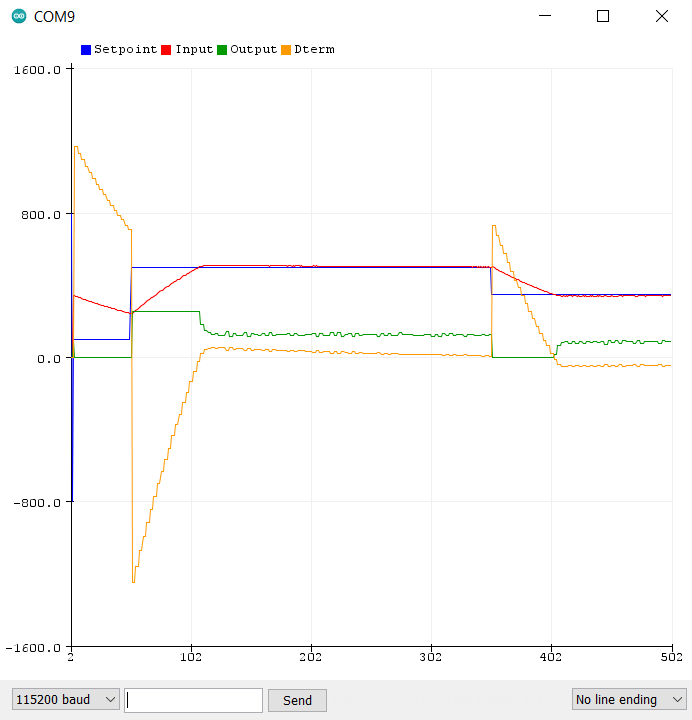 |
On this system, the Derivative on Error plot shows a significant improvement on the input overshoot (red trace) and the output (green trace) seems less noisy even when accounting for the increased scaling. No output spikes can be seen but that's probably due to the auto-tuned kp, ki and kd gains that are used.
EDIT: Additional reference: Derivative Action and PID Control
I think its definitely worthwhile adding a "Derivative on Error" option in the next revision!
Activity
Dlloydev commentedon May 28, 2021
Completed .... see new QuickPID version 2.4.0